
Display a Function of Two Variables
QUESTION: I have two vectors, X and Y, and I would like to display a function of these two vectors, f(X,Y), as an image with a colorbar representing the values of the function. Can you help me do this?
![]()
ANSWER: The only trick here is to know how to construct the appropriate 2D arrays from your X and Y vectors. Dimensional juggling skills are the essential arrows you need in your quill.
First, let's construct a couple of vectors to illustrate. In this particular case, the X vector will have 51 elements and the Y vector will have 26 elements.
x = Findgen(51) y = RandomU(-3L, 26) * 10
Now we use our dimensional juggling skills to create 2D arrays of the X and Y vectors.
xarray = Rebin(x, 51, 26) yarray = Rebin(Reform(y, 1, 26), 51, 26)
Next, we create the function of these two variables.
f = xarray^2 - 3*yarray^3 + 2*(xarray + yarray)
Finally, we display the function of these two variables as an image, along with a color bar representing the value of the function. We use the Coyote Library routines TVImage and FSC_Colorbar in this step.
    LoadCT, 39, /SILENT
   TVImage, BytScl(f, TOP=254), Position=[0.1, 0.1, 0.9, 0.75], $
      AXES=1, /ERASE, BACKGROUND='charcoal'
   FSC_Colorbar, RANGE=[Min(f), Max(f)], FORMAT='(F0.2)', NCOLORS=254
You can see the results in the figure below.
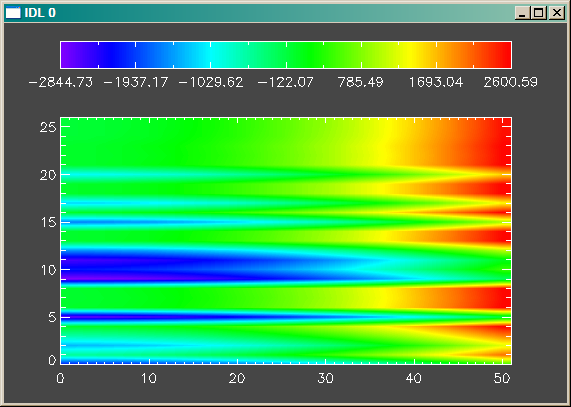 |
| A function of two variables displayed as an image. |
Naturally, you can also display this function as a surface or contour plot if you would prefer.
![]()
Version of IDL used to prepare this article: IDL 7.0.3.
![]()
Copyright © 2009 David W. Fanning
Last Updated 25 June 2009