
Creating a Transparent Polygon
QUESTION: I have a linear plot that I would like to draw a polygon on top of, but still be able to see the underlying plot. Currently, the polygon is drawn on top of the existing plot, but the color is not transparent so I cannot see the data that is below the polygon. I cannot draw the polygon first and then redraw the plot using OPlot because I do have have access to the IDL source code. Do you have any suggestions?
![]()
ANSWER: Assuming you have a 24-bit display, this is dead simple. (Even if you don't have a 24-bit display, it is dead simple, since it is easy enough to create 24-bit images if you need them.) The idea is to create two 24-bit images. One will contain the line plot. The other will contain the same line plot, but with the polygon drawn on top of it. You can create these images directly from IDL graphics windows, or pixmap windows, or a combination of the above. I use regular graphics windows in the example below, so you can see the intermediate results.
Once you have the two images, you alpha blend the two images to produce the final image with the transparent polygon.
To see how this is done, let's create some data. If you like, you can download the source code file. You will need programs from the Coyote Library to run the code.
    ; Create some data.    signal = cgDemoData(1) - 15
   time = Findgen(N_Elements(signal)) * 6.0 / N_Elements(signal)
Next, we create the two windows we are going to use to obtain the 24-bit images we need later on.
    ; Create some windows.    cgDisplay, Title='Data Window', /FREE
   dataWin = !D.Window    cgDisplay, Title='Polygon Window', /FREE
   polyWin = !D.Window
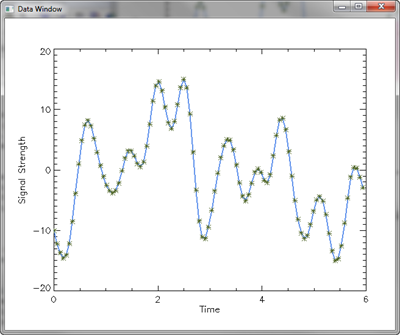
Now we draw the first plot in the data window, and take a “snapshot” of the window. The snapshot is the 24-bit image we are looking for. We will call this image the background image, since it represents the background of our final image.
   ; Draw plot in data window.    WSet, dataWin
   cgPlot, time, signal, COLOR='navy', /NODATA, $
      XTitle='Time', YTitle='Signal Strength'
   cgPlot, time, signal, THICK=2, COLOR='cornflower blue', /Overplot
   cgPlot, time, signal, PSYM=2, COLOR='olive', /Overplot
   ; Take a snapshot.    background = cgSnapShot()
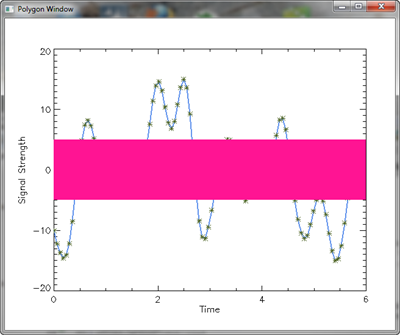
We next copy this window into the polygon window. Once there, we draw the polygon in the window, on top of the line plot, and then take a snapshot of this window, too. We use the Device Copy technique to copy the data window contents, since it is extremely fast. We will call this image the foreground image.
    ; Copy data window and draw a polygon in the polygon window.
   WSet, polyWin    DEVICE, COPY=[0, 0, !D.X_Size, !D.Y_Size, 0, 0, dataWin]
   cgColorFill, [ 0,  6, 6, 0,  0], $
                [-5, -5, 5, 5, -5], /DATA, $                 COLOR='deep pink'
                 ; Take a snapshot of this window.    foreground = cgSnapshot()
The final step is to display our final alpha-blended image. We set the alpha factor to however much transparency we want. Values range from 0 (completely transparent) to 1 (completely non-transparent). Let's set a value for 25 percent transparency and draw the alpha-blended image.
   cgDisplay, Title='Transparent Polygon Window', /FREE
   cgBlendImage, foreground, background, ALPHA=0.25
You can see all three of the windows in the figure below.
 |
 |
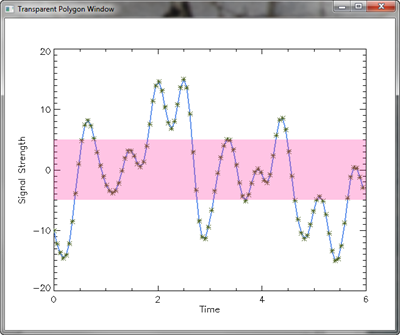 |
| The first two windows are what we created the 24-bit images from. The last window contains our alpha-blended transparent image. | ||
![]()
Version of IDL used to prepare this article: IDL 7.0.1.
![]()
Copyright © 2008 David W. Fanning
Written: 13 June 2008
Last Updated: 26 May 2014