
Constructing a Color Table in IDL
QUESTION: Can you show me how to construct a color table in IDL?
![]()
ANSWER: Several people have asked me recently how to construct a color table. I've taken this to mean (perhaps erroneously) that there might be general interest in the subject. :-)
So here is how I might go about it. I'll construct a simple color table first, then a more complicated one to give you the general idea of how even very complex color tables might be constructed.
![]()
A Simple Color Table
First, suppose you want a color table that goes from yellow in the first color index to red in the last color index. And suppose further that you want to have 200 colors or shades in the color table. You know that the color yellow is represented by the RGB color triple (255,255,0) and that the color red is represented by the RGB triple (255,0,0).
You know also that to create a color table you need three vectors, representing the red, green, and blue color values of the colors that make up the color table. The trick, therefore, is to know how to make up those color vectors. Another way to say this is that we need to know the RGB values of all the colors in a smooth progression from yellow to red.
What would constitute a smooth progression of colors? Well, clearly the red vector values need to go from the starting red value in the yellow color to the ending red value in the red color. The same can be said for the green vector values and the blue vector values. In fact, we can write a general expression to go from any number to some other number in a arbitray number of steps. The expression looks like this:
vector = beginNum + (endNum - beginNum) * scaleFactor
where we have to define the beginning number, the ending number, and the scale factor (which will depend upon the number of steps we want to take).
Suppose we define these quantities like this:
   beginNum = 10.0
   endNum = 20.0
   steps = 5
   scaleFactor = FINDGEN(steps) / (steps - 1)
Then, using the equation above, we print:
PRINT, beginNum + (endNum - beginNum) * scaleFactor
We get:
10.0000 12.5000 15.0000 17.5000 20.0000
So far, so good. Let's apply this to our color table problem. We want the red vector value to go from 255 (the red value in the yellow color) to 255 (the red value in the red color). The green vector needs to go from 255 to 0. The blue vector needs to go from 0 to 0.
Pretty simple. We probably don't even need to apply the algorithm for the red or blue vectors. We can simply write:
   steps = 200
   redVector = REPLICATE(255, steps)
   blueVector = REPLICATE(0, steps)
The green vector (according to the algorithm) is:
   scaleFactor = FINDGEN(steps) / (steps - 1)
   beginNum = 255
   endNum = 0
   greenVector = beginNum + (endNum - beginNum) * scaleFactor
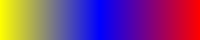
Alright, now load these color vectors, and there you have it, a color table smoothly progressing from yellow to red!
TVLCT, redVector, greenVector, blueVector
Here is an example of the color table you just created.

![]()
A More Complicated Color Table
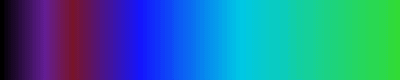
Well, how about a more complicated example. Suppose you want a color table (still 200 colors) that goes from yellow to red, but you want it go through a series of blue colors in the middle of the table.
You can divide this into two problems similar to the first example. In other words, in 100 steps go from yellow (255,255,0) to blue (0,0,255), and then in 100 more steps go from blue to red (255,0,0). Your code might look like this:
   steps = 100
   scaleFactor = FINDGEN(steps) / (steps - 1)

   ; Do first 100 colors (yellow to blue).
   redVector = 255 + (0 - 255) * scaleFactor   ; Red vector: 255 -> 0
   greenVector = 255 + (0 - 255) * scaleFactor ; Green vector: 255 -> 0
   blueVector = 0 + (255 - 0) * scaleFactor    ; Blue vector: 0 -> 255

   ; Do second 100 colors (blue to red).
   redVector = [redVector, 0 + (255 - 0) * scaleFactor]     ; Red vector: 0 -> 255
   greenVector = [greenVector, REPLICATE(0, steps)]         ; Green vector: 0 -> 0
   blueVector = [blueVector, 255 + (0 - 255) * scaleFactor] ; Blue vector: 255 -> 0
Finally, load your new color table:
TVLCT, redVector, greenVector, blueVector
Here is an example of the color table you just created.
This concept can easily be extended to interpolating colors between any starting and ending color triples. Consider, for example, a color table with these specific values.
| Color Index | Red | Green | Blue |
| 0 | 0 | 0 | 0 |
| 28 | 100 | 30 | 150 |
| 46 | 120 | 20 | 40 |
| 89 | 20 | 20 | 255 |
| 153 | 0 | 200 | 230 |
| 255 | 50 | 220 | 80 |
Since the specified values are not equidistant, these values must be interpolated like this.
   r = Interpol([0,100,120, 20,  0, 50], [0, 28, 46, 89, 153, 255], Findgen(256))
   g = Interpol([0, 30, 20, 20,200,220], [0, 28, 46, 89, 153, 255], Findgen(256))
   b = Interpol([0,150, 40,255,230, 50], [0, 28, 46, 89, 153, 255], Findgen(256))
   TVLCT, r, g, b
You see the result in the figure below.
By the way, you don't necessarily have to write your own code to do this (although if you do you will have the advantage of understanding what you are doing) because this is exactly what XPALETTE allows you to do when you interpolate between two colors that you have marked by clicking on them with the cursor!
In the figure below, you see two types of color bars that can be created by programs in the Coyote Library. The discrete colorbar on top is created with the cgDCBar program and the continuous colorbar on the bottom is created with the cgColorbar program.
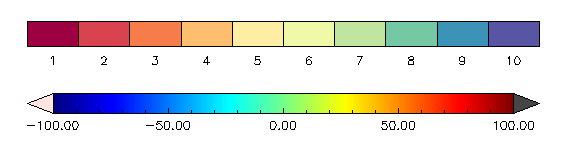 |
| Two types of colorbars available in the Coyote Library. |
![]()
Written 8 January 2006
Updated 28 September 2010
