
Adding a Color Background to a Plot
QUESTION: I'd like to have a color background on my plot. I know about using the Background keyword to establish the background for the display window, but that's not what I am talking about. I want just the area of the plot enclosed by the axes in a different color. I've tried adding this background with the Polyfill command, but then my plot tick marks disappear. Is there a better way to do this?
![]()
ANSWER: If you position your plot with the Position keyword, then you can draw your background polygon first into that position, then draw your plot with the NoErase keyword set. (You might want to erase the window first with the Erase command, since with this method you will be losing the Plot command's ability to erase whatever is currently in the window before it draws. This would be a good time to get the area outside the polygon the color you want, since you can use the Color keyword here as well.) Here is an example of what I mean.
   p = [0.15, 0.15, 0.9, 0.9] ; Position of the plot in the window.
   Erase, COLOR=FSC_COLOR('papaya')
   PolyFill, [p[0],p[0],p[2],p[2],p[0]], $
             [p[1],p[3],p[3],p[1],p[1]], $
             COLOR=FSC_COLOR('tan'), /NORMAL
   Plot, findgen(11), COLOR=FSC_COLOR('dark red'), $
      POSITION=p, /NOERASE
   PlotS, findgen(11), findgen(11), PSYM=2, $
      COLOR=FSC_COLOR('royal blue')
Executing these command results in the following figure. (You will need the FSC_Color program from the Coyote Library to run the code.)
 |
| A plot with a colored background inside the axes. |
Note that direct graphics commands just put pixels on top of pixels, so sometimes you have to "layer" your graphics commands to achieve the results you want. The NoErase keyword is a great help when you are re-drawing axis tick marks and the like.
![]()
Adding Backgrounds with Multiple Plots
QUESTION: Well, sure, this works fine for a single plot. But what if I am drawing multiple plots using !P.MULTI? It doesn't work at all then. How can I do the same thing with multiple plots?
![]()
ANSWER: Ah, then you have to be a little more clever than you were before. Two pieces of information are required. First, every time you issue a graphics command that would, on its own, erase the window, !P.MULTI adjusts the plot positioning system variables so that the plot goes into the new plot space. This makes it hard to "clean up" the plot by the layering method described above. In other words, even if you use a PLOT command with a NOERASE keyword set, the plot goes into the next space, not the space you are trying to draw it into. So you have to trick !P.MULTI into doing the right thing for you.
This brings up the second piece of information you need: the meaning of the first element of the !P.MULTI vector. !P.MULTI[0] indicates how many plots remain to be plotted on the page. So, if I have four plots on the page, and I draw the first plot, !P.MULTI[0] is set to 3, since there are three plots remaining to be plotted on the page.
   IDL> !P.MULTI=[0,2,2] ; Four plots on a page.
   IDL> Plot, Findgen(11)
   IDL> Print, !P.MULTI[0]
	3
   IDL> Plot, Findgen(11)
   IDL> Print, !P.MULTI[0]
	2
   IDL> Plot, Findgen(11)
   IDL> Print, !P.MULTI[0]
	1
   IDL> Plot, Findgen(11)
   IDL> Print, !P.MULTI[0]
	0
If I am just staring to draw a plot, !P.MULTI[0] is set to 4, but since there are four plots to be plotted, this is set internally to 0 (please don't ask). Or, rather, 4 is the equivalent of 0, but it is the 0 that tells !P.MULTI to erase the page and start a new set of plots. Clear?
Don't worry about it. Trust me. Think of it like this:
!P.MULTI[0] = (Number of plots remaining to be drawn) MOD (Total number of plots)
The point is, we can manipulate !P.MULTI[0] to trick !P.MULTI into doing things for us that it didn't intend to do. That's what we are going to do to put background colors in multiple plots.
One final point, before I show you the code. You can't use positional parameters like the POSITION keyword on your plots when you are using !P.MULTI. This is because !P.MULTI is manipulating the plot position for you. If you try to do the same, the result is a muddled mess. However, you can tell where !P.MULTI positioned your plot (after it is drawn) from the !X.WINDOW and !Y.WINDOW system variables.
OK, here is the code for producing a 2 by 2 arrangement of four plots.
   ; Set up for 2x2 plot sequence
   !P.MULTI=[0,2,2]

   ; First plot. Use BACKGROUND keyword to set background for all plots.
   Plot, findgen(11), COLOR=FSC_COLOR('dark red'), BACKGROUND=FSC_COLOR('papaya')

   ; Position of the plot in the window. Fill with POLYFILL.
   p = [!X.Window[0], !Y.Window[0], !X.Window[1], !Y.Window[1]]
   PolyFill, [p[0],p[0],p[2],p[2],p[0]], $
             [p[1],p[3],p[3],p[1],p[1]], $
             COLOR=FSC_COLOR('tan'), /NORMAL

   ; Rewind plot counter, "fix" the plot, then reset for NEXT plot.
   !P.MULTI[0] = 0
   Plot, findgen(11), COLOR=FSC_COLOR('dark red'), /NOERASE
   PlotS, findgen(11), findgen(11), PSYM=2, COLOR=FSC_COLOR('royal blue')
   !P.MULTI[0] = 3

   ; Second plot.
   Plot, findgen(11), COLOR=FSC_COLOR('dark red')

   ; Position of the plot in the window. Fill with POLYFILL.
   p = [!X.Window[0], !Y.Window[0], !X.Window[1], !Y.Window[1]]
   PolyFill, [p[0],p[0],p[2],p[2],p[0]], $
             [p[1],p[3],p[3],p[1],p[1]], $
             COLOR=FSC_COLOR('tan'), /NORMAL

   ; Rewind plot counter, "fix" the plot, then reset for NEXT plot.
   !P.MULTI[0] = 3
   Plot, findgen(11), COLOR=FSC_COLOR('dark red'), /NOERASE
   PlotS, findgen(11), findgen(11), PSYM=2, COLOR=FSC_COLOR('royal blue')
   !P.MULTI[0] = 2

   ; Third plot.
   Plot, findgen(11), COLOR=FSC_COLOR('dark red')

   ; Position of the plot in the window. Fill with POLYFILL.
   p = [!X.Window[0], !Y.Window[0], !X.Window[1], !Y.Window[1]]
   PolyFill, [p[0],p[0],p[2],p[2],p[0]], $
             [p[1],p[3],p[3],p[1],p[1]], $
             COLOR=FSC_COLOR('tan'), /NORMAL

   ; Rewind plot counter, "fix" the plot, then reset for NEXT plot.
   !P.MULTI[0] = 2
   Plot, findgen(11), COLOR=FSC_COLOR('dark red'), /NOERASE
   PlotS, findgen(11), findgen(11), PSYM=2, $
      COLOR=FSC_COLOR('royal blue')
   !P.MULTI[0] = 1

  ; Fourth plot.
   Plot, findgen(11), COLOR=FSC_COLOR('dark red')

   ; Position of the plot in the window. Fill with POLYFILL.
   p = [!X.Window[0], !Y.Window[0], !X.Window[1], !Y.Window[1]]
   PolyFill, [p[0],p[0],p[2],p[2],p[0]], $
             [p[1],p[3],p[3],p[1],p[1]], $
             COLOR=FSC_COLOR('tan'), /NORMAL

   ; Rewind plot counter, and "fix" the plot.
   !P.MULTI[0] = 1
   Plot, findgen(11), COLOR=FSC_COLOR('dark red'), /NOERASE
   PlotS, findgen(11), findgen(11), PSYM=2, $
      COLOR=FSC_COLOR('royal blue')

  ; Set back to single plot.
  !P.MULTI = 0
You see the result in the figure below.
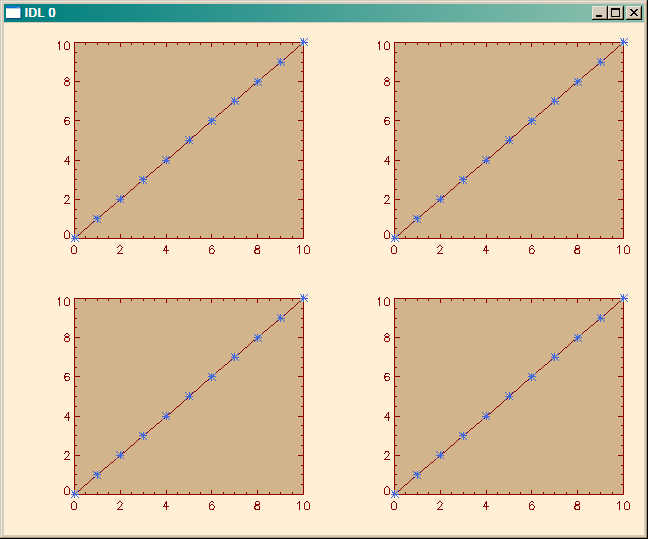 |
| A multi-plot with a colored background inside the axes of each plot. |
![]()
Copyright © 2006 David W. Fanning
Last Updated 17 November 2006