
Drawing a Multi-Colored Line
QUESTION: I would like to draw a line plot, but I would like the points on the line, and the line itself to be drawn different colors, starting with the lowest color in color table 34 and going to the highest color in color table 34. Can you suggest a way to do this?
![]()
ANSWER: The only trick to doing this is to create a color vector of the correct length to match the data, and scaled into the colors of your color table (from 0 to 255 in this case). This is easily done with cgScaleVector, from the Coyote Library.
Here is an example of how I would do this for a line that was colored sequentially in time.
    y = cgDemoData(17)
   s = N_Elements(y)    x = Indgen(s)
   colors = Round(cgScaleVector(Findgen(s), 0, 255))
   cgPlot, x, y, /NoData, Color='Charcoal', Background='ivory'    cgLoadCT, 34
   FOR j=0,s-2 DO cgPlotS, [x[j], x[j+1]], [y[j], y[j+1]], Color=StrTrim(colors[j],2), Thick=2
   FOR j=0,s-1 DO cgPlotS, x[j], y[j], PSym=2, Color=StrTrim(colors[j],2)
You see the results in the figure below.
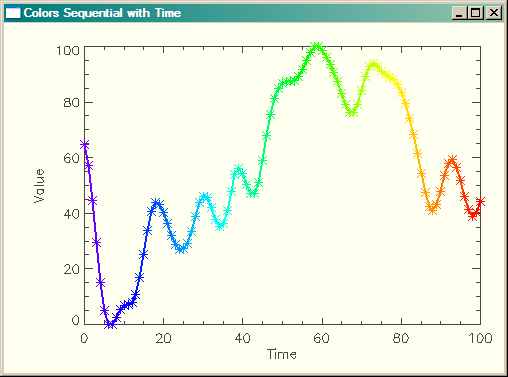 |
| A multi-colored line plot in IDL, with colors sequential in time. |
If you wanted the data to be colored sequentially in value, you would have to do a bit more manipulation with Value_Locate. Here is an example of how I would create a colored line with the colors sequential in value.
   colors = cgScaleVector(Findgen(s), Min(y), Max(y))
   elevColors = Value_Locate(colors, y)
   elevColors = StrTrim(Round(cgScaleVector(elevColors, 0, 255)),2)
   cgPlot, x, y, /NoData, Color='Charcoal', Background='ivory'    cgLoadCT, 34
   FOR j=0,s-2 DO cgPlotS, [x[j], x[j+1]], [y[j], y[j+1]], Color=elevColors[j], Thick=2
   FOR j=0,s-1 DO cgPlotS, x[j], y[j], PSym=2, Color=elevColors[j]
You see the results in the figure below.
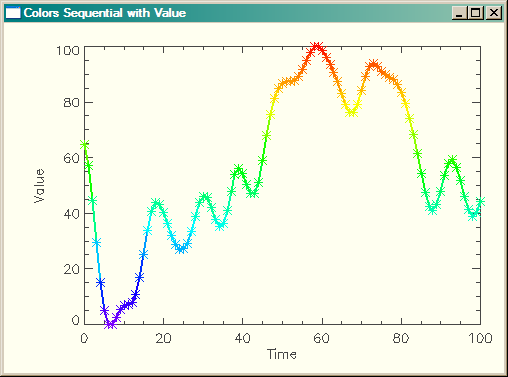 |
| A multi-colored line plot in IDL, with colors sequential in value. |
![]()
Version of IDL used to prepare this article: IDL 7.0.3.
![]()
Copyright © 2009 David W. Fanning
Last Updated 1 March 2009