
Wave Length verses Wave Number
QUESTION: I am plotting charts with wavelength or wave number on the x-axis. Is there any way to put one on the bottom x-axis and one on the top x-axis, while having their values correlate together? In other words, is there a way to get my wavelength value to correlate directly to its appropriate wave number value on the opposite axis?
![]()
ANSWER: Yes, of course. The important thing here is to calculate the X axis ranges for both the wave length and wave number and then to tell IDL to plot the exact axis ranges. You cannot allow IDL to autoscale your axes if you want a one-to-one correspondence.
Here is an example. First, create the data to plot. Let's let the wave lengths range from 0.534 mm to 6.23 mm in length. The Y axis will just be random data scaled in the range of 0 to 30 for this example.
   PRO WaveNumber_Plot
    xdata = Findgen(100)+1
    xdata = cgScaleVector(xdata, 5.34, 62.3) ; Wavelength between 5.34 cm and 62.3 cm.
    ydata = Congrid(cgDemoData(17), 100)
    xwavelengthRange = [5.34, 62.3] ; In centimeters
Next, let's calcuate the wave length data range:
xwavelengthRange = [0.534, 6.23] ; In millimeters
Finally, let's create a window and draw the plot. The code will look like this:
   cgDisplay, 750, 300
   cgPlot, xdata, ydata, XStyle=9, Position=[0.15, 0.15, 0.9, 0.820], $
        XRange=xwavelengthRange, Charsize=1.25, Color='red', Thick=2, $
        XTitle = 'Wavelength (cm)', YTitle='Signal Strength'
   cgAxis, XAxis=1.0, XRange=xwavelengthRange, $
       XStyle=1, Charsize=1.25, XTickFormat='WaveNumberFormat'
   xlocation = (!X.Window[1] - !X.Window[0]) / 2  + !X.Window[0]
   ylocation = !Y.Window[1] + 2.75 * (!D.Y_CH_Size / Float(!D.Y_Size))
   cgText, xlocation, ylocation, 'Wave Number (x10!U-8!N ' + String(197B)+'!U-1!N)', $
       /Normal, Alignment=0.5, Charsize=1.25
   END
Notice that I have set the XTickFormat keyword equal to the name of a formatting function that I haven't written yet. It will be the purpose of this function to turn the value coming into it, which will be a wave length, into a wave number. We can easily write the function like this:
   FUNCTION WaveNumberFormat, axis, index, value
       ; A function used to calculate the wavenumber, given the wavelength.
       wavenum = 1.0d / value     ; frequency
       RETURN, String(wavenum, Format = '(f0.4)')
   END
Here is the complete code. You see the results of the IDL commands in the figure below.
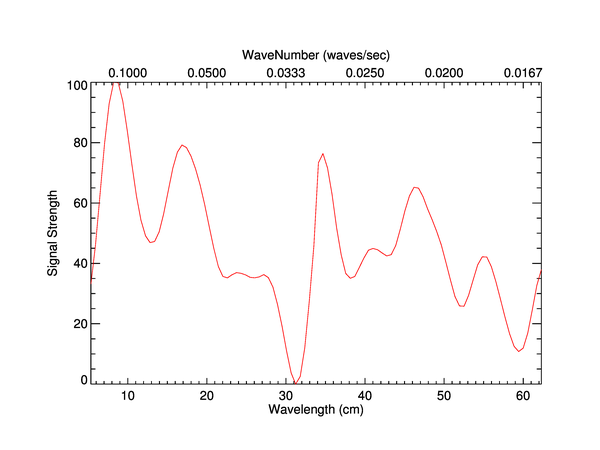
![]()
Written 13 May 2003
Last Updated 26 July 2013