
Creating Colorbars For Log-Scaled Images
QUESTION: I love your routines (GmaScl, LogScl, and AsinhScl) for increasing the contrast in images, but I don't understand how to create a colorbar that I can use to show the resulting values in the image. Do you have any ideas about this?
![]()
ANSWER: To properly display a color bar with a log-scaled image, I think you have to perform an identical transformation on the color table vectors. To see how this works, let's create an image. We will use a power spectrum, which is often log-scaled to see the details.
    image = cgDemoData(11)    freqDomainImage = FFT(image, -1)
   power = SHIFT(ALOG(ABS(freqDomainImage)), 124, 124)
   power = power - Min(power)    minPower = Min(power)    maxPower = Max(power)
First, let's see how the image look with normal linear byte scaling. We type these commands.
    cgLoadCt, 4, /BREWER, /REVERSE
   cgDisplay, 400, 400, WID=0, TITLE='Normal Linear Scaling'
   cgImage, BytScl(power), Position=[0.1, 0.1, 0.9, 0.75], /ERASE
   cgColorbar, RANGE=[minPower, maxPower], DIVISIONS=4, FORMAT='(F0.2)', $
      XTICKLEN=1.0, XMINOR=0, FONT=0
You see the result in the figure below.
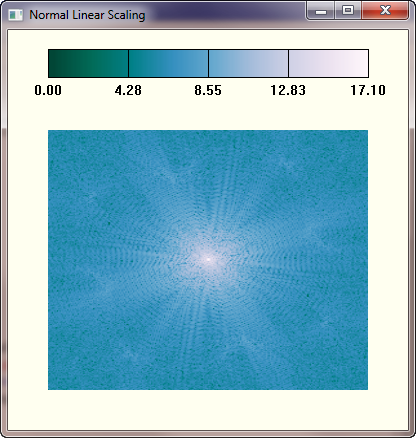 |
| The power image scaled linearly. |
To create the proper colors for our color table (we will use LogScl for the transformation), we need to perform the same scaling on both the image and the color table vectors. The scaled color vectors are then used as indices into the original color vectors to obtain the final color table values. The code for performing these operations looks like this.
   cgLoadCT, 4, /BREWER, /REVERSE    TVLCT, r, g, b, /GET
   rscaled = LogScl(cgScaleVector(Float(r), minPower, maxPower, MIN=0, MAX=255))
   gscaled = LogScl(cgScaleVector(Float(g), minPower, maxPower, MIN=0, MAX=255))
   bscaled = LogScl(cgScaleVector(Float(b), minPower, maxPower, MIN=0, MAX=255))
   TVLCT, r[rscaled], g[gscaled], b[bscaled]
With the proper colors loaded, we can display the scaled image and the color bar.
   cgDisplay, 400, 400, WID=1, TITLE='Logarithmic Scaling'
   cgImage, LogScl(power), Position=[0.1, 0.1, 0.9, 0.75], /ERASE
   cgColorbar, RANGE=[minPower, maxPower], DIVISIONS=4, FORMAT='(F0.2)', $
      XTICKLEN=1.0, XMINOR=0, FONT=0
The results can be seen in the figure below.
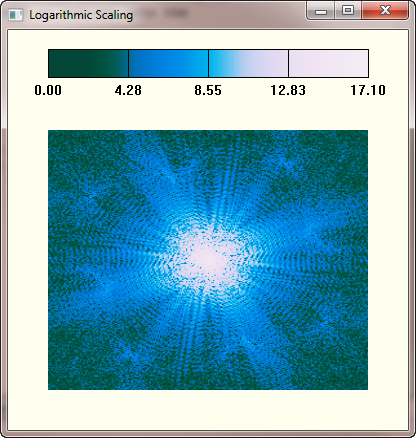 |
| The power image log-scaled with the appropriate color bar. |
![]()
Version of IDL used to prepare this article: IDL 7.1.2
![]()
Copyright © 2010 David W. Fanning
Last Updated 24 July 2010