
Filling the Plot Window
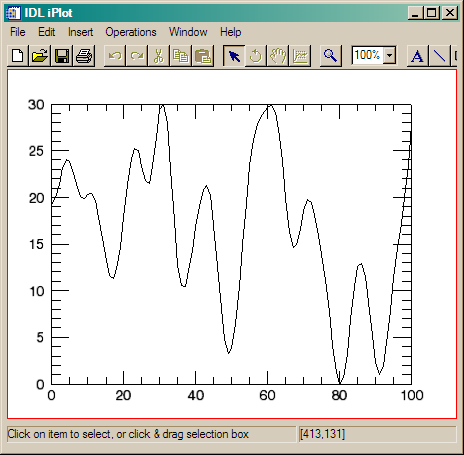
QUESTION: Is there any way to programmatically make the plot in an iPlot window actually occupy more than just a small portion of the graphics window? Perhaps I'm thick, but this has been bugging me for a while, and I can't figure out how to do it.
![]()
ANSWER: The answer to this question comes from Mike Galloy in a 6 April 2007 article on the IDL Newsgroup.
Yes, I would appreciate an easy way to do this too, like an XMARGIN and YMARGIN keywords that work like the PLOT commands. Currently, I get the visualization layer and set the VIEWPLANE_RECT property to get the margins I want.
There will be (presumably) a FIT_TO_VIEW keyword in IDL 6.4 which will make the visualization to take up the entire view.
In the meantime, here is a wrapper for iPlot that handles margins for the plot.
    ;+
    ; Wrapper routine for iPlot which handles margins for the plot also.
    ;
    ; @param x {in}{required}{type=1D numeric array}
    ;        x-coordinates of data if y param is passed or y-coordinates of data
    ;        if only x is passed
    ; @param y {in}{optional}{type=1D numeric array}
    ;        y-coordinates of data
    ; @keyword xmargin {in}{optional}{type=fltarr(2)}{default=[0.1, 0.1]}
    ;          size of left and right margins in window normal units
    ; @keyword ymargin {in}{optional}{type=fltarr(2)}{default=[0.1, 0.1]}
    ;          size of bottom and top margins in window normal units
    ; @keyword _extra {in}{optional}{type=keywords}
    ;          keywords to iPlot
    ;-
    pro iplot_with_margins, x, y, xmargin=xmargin, ymargin=ymargin, _extra=e
      compile_opt strictarr

      myXMargin = n_elements(xmargin) eq 0 ? [0.1, 0.1] : xmargin
      myYMargin = n_elements(ymargin) eq 0 ? [0.1, 0.1] : ymargin

      case n_params() of
      0 : iplot, _strict_extra=e
      1 : iplot, x, _strict_extra=e
      2 : iplot, x, y, _strict_extra=e
      endcase
      toolID = itGetCurrent(tool=oTool)

      visIds = oTool->findIdentifiers('*', /visualization)
      visLayerId = strmid(visIds[0], 0, strpos(visIds[0], '/', / reverse_search))
      oVisLayer = oTool->getByIdentifier(visLayerId)


      xsize = 1.4 / (1.0 - myXMargin[0] - myXMargin[1])
      ysize = 0.98 / (1.0 - myYMargin[0] - myYMargin[1])
      xstart = - myXMargin[0] * xsize - 1.4 / 2
      ystart = - myYMargin[0] * ysize - 0.98 / 2

      oVisLayer->setProperty, viewplane_rect=[xstart, ystart, xsize, ysize]
    end
 |
| Using the wrapper program by Mike Galloy, the initial plot in an iPlot window fills the available space in the graphics window. |
![]()
Copyright © 2007 David W. Fanning
Last Updated 8 April 2007