
Converting Contour Output to Shapefiles
QUESTION: I have used the CONTOUR keywords PATH_INFO and PATH_XY to create polygons that I use to create a shapefile of an area. I wish to use this shapefile on a map projection. For the most part, this works well, but the shapefile boundaries are not lined up correctly. Here is a figure to show you what I mean. Notice the outline of the colored data is almost correct, but not quite. Can you explain what I am doing wrong?
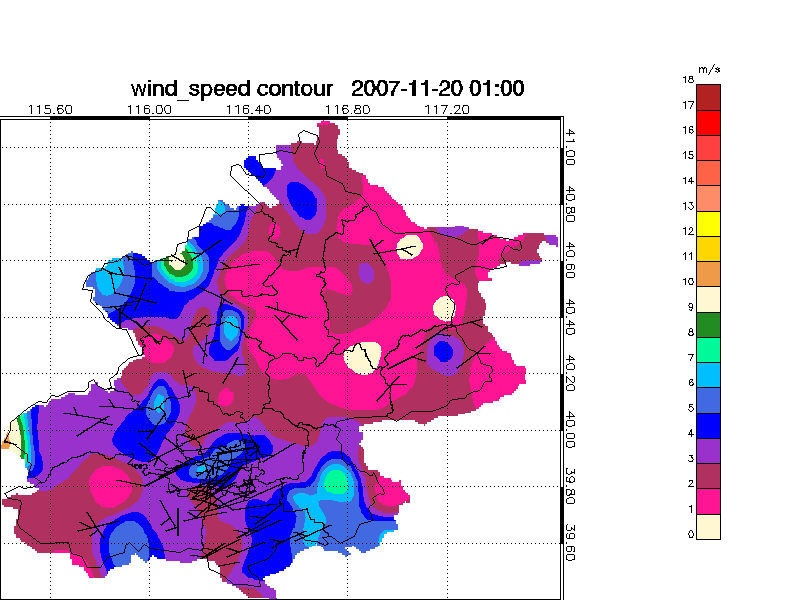 |
| Notice the boundary of the colored areas in the map is almost correct, but not quite. |
![]()
ANSWER: There are several possibilities for what might have gone wrong here. The most common mistake is to allow IDL to autoscale your axes when you create your contour plot. (This looks like the problem here.) In general with contour plots, and especially when you wish to combine the output of contour plots with other graphics, you never want to allow axis autoscaling to occur. This means you must set the XStyle and YStyle keywords to 1. (Or to some combination value that sets the exact axis scaling bit in the [XY]Style keywords.) If this is not done, then the axis range of your contour plot can be larger than you think it is. This will cause exactly this kind of alignment problem.
Contour, mydata, PATH_INFO=info, PATH_XY=xy, XSTYLE=1, YSTYLE=1
A second possibility is that you have recovered your path information in normalized coordinates (which is the default), rather than in the latitude and longitude coordinates you might have expected. (Nearly all of IDL's graphics commands work in the data coordinate space by default. This path information scheme is the only graphics command I can think of that returns information in the normalized coordinate space by default.) If this is true, then you can get this kind of mis-alignment if your Contour command and Map_Set command are not writing into exactly the same position in a window of exactly the same size. To rectify an error like this, you could make sure your windows are the same size, and that you position both graphics commands with the same Position keyword.
However, a better way to solve this problem is to capture the path information in your latitude/longitude data coordinate space. To collect path information in data coordinate space, rather than normalized coordinate space, you must (at a minimum) set the Path_Data_Coords keyword.
Contour, mydata, PATH_INFO=info, PATH_XY=xy, XSTYLE=1, YSTYLE=1, /PATH_DATA_COORDS
But, rarely is this enough. You also have to set up the data coordinate space appropriately. Let me show you what I mean with some fake data that I will create with the LoadData command.
   IDL> data = LoadData(2)
   IDL> Help, data
        DATA            FLOAT     = Array[41, 41]
   IDL> MinMax, data
        0.000000      1550.00
Suppose this data represents data collected between -80 and -60 degrees of longitude and between 20 and 40 degrees of latitude. I might try to contour the data and set up the data coordinate space like this:
   IDL> Contour, data, LEVEL=750, PATH_INFO=info, PATH_XY=xy, XSTYLE=1, YSTYLE=1, $
            /PATH_DATA_COORDS, XRANGE=[-80,-60], YRANGE=[20,40]
This would give me (if I left off all the path keywords) a contour plot labelled correctly from -80 to -60 on the X axis and from 20 to 40 on the Y axis. And if I clicked a cursor in the plot and read the X and Y values, I would see that IDL had even set up a proper data coordinate space for me, so that my location values would be in the data range. But, oddly, the proper data coodinate space is not set up when I use the path keywords, because look:
   IDL> MinMax, xy[0,*] ; Longitude path values
        0.000000      40.0000
   IDL> MinMax, xy[1,*] ; Latitude path values
        0.000000      40.0000
It appears the “data” coordinate system returned by the path keywords is defined differently from the “data” coordinate system set up by the Contour command. (Sigh...)
To make them the same, it is necessary to pass the X and Y vectors representing the longitude and latitude data ranges, rather than specifying the data coordinate ranges with the XRange and YRange keywords. I am going to use cgScaleVector to create the proper vectors. The code will look like this.
   IDL> s = Size(data, /Dimensions)
   IDL> lon = cgScaleVector(Findgen(s[0]), -80, -60)
   IDL> lat = cgScaleVector(Findgen(s[1]), 20, 40)
   IDL> Contour, data, LEVEL=750, PATH_INFO=info, PATH_XY=xy, XSTYLE=1, YSTYLE=1, $
            /PATH_DATA_COORDS, lon, lat
Having set the data coordinate system up properly, now we find that the path information is in the proper coordinate system.
   IDL> MinMax, xy[0,*] ; Longitude path values
        -80.0000     -60.0000
   IDL> MinMax, xy[1,*] ; Latitude path values
         20.0000      40.0000
Implementing any (or all) of these fixes, we now find that the shapefile works with the map projection anywhere and anytime.
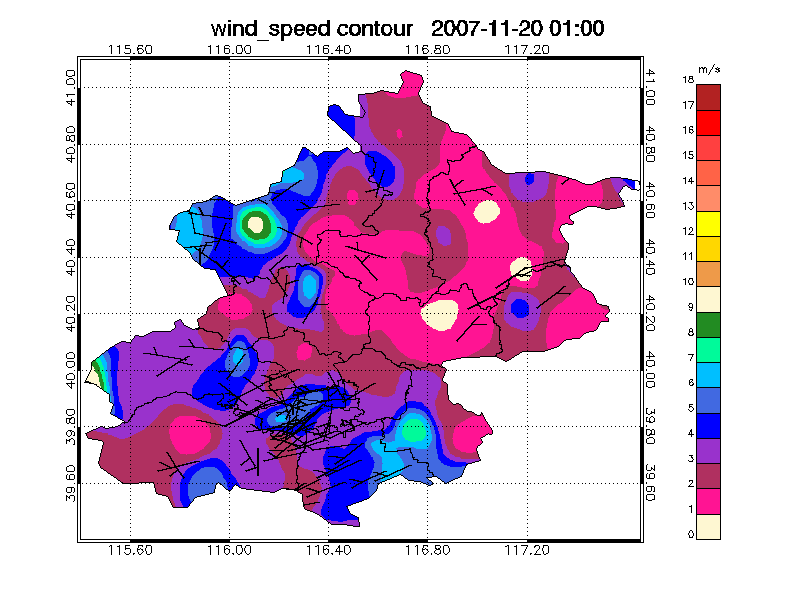 |
| The perfectly aligned shapefile on a map projection. |
![]()
Copyright © 2008 David W. Fanning
Last Updated 1 January 2008