
Coordinate Systems for Satellite Images
QUESTION: I downloaded a satellite image from the Internet. It is in a particular map projection. How can I set up a map coordinate system for this image so that I can read latitude and longitude information from it and draw overlays on top of it? I think what I want to do is georeference this image. Is that right?
![]()
ANSWER: This probably is what you want to do, but I can't show you how to do that. Most people use ENVI to georegister images, because those folks know what they are doing. What I'm about to show you is what I call the poor man's way to georeference an image. For God's sake don't use what I am about to show you for science! Rather, treat is as a hack that in some limited way, under certain extremely limited conditions, can sometimes (almost) give you what you want.
I'm mostly writing this article because I get asked these questions more and more frequently, and it takes me an entire half a day to come up with an answer. I'm going to give you the basics so you can do the hard work rather than me.
First of all, most images you download from the Internet have already been warped into some kind of map projection. If you don't know what this is, and you can't find out, you are in some trouble. Fortunately, most satellite images are in some type of normal map projection, so you ought to be able to find the right one without too much trial and error. Start with Mercador or Cylindrical and work your way up to more exotic map projections from there.
The image I am going to work with in this example, is a geostationary picture of the Earth from the Meteosat-5 satellite positioned over the Indian Ocean. The data was downloaded from the Dundee Satellite Receiving Station as an 8-bit JPEG file. It is 1250 by 1250 pixels in size. The original image is in the figure below at one-fourth its original size.
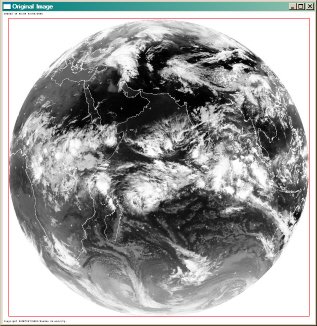
Notice in the lower and upper left corners of the image there is some writing that has been added to the image to identify it. In fact, there is a small border around the image (which I have outlined in red on this original image) that you will need to eliminate before you start creating a map coordinate system for the image. It is not at all unusual for the suppliers of these images to add a border.
How big is the border? I don't know. It varies. Typically you find the border by inspection. For this particular image, I put the image in a window the same size as the image, and then used the CURSOR command to locate the edges of the actual image data (the Earth).
   IDL> s = Size(image, /Dimensions)
   IDL> Window, XSize=s[0], YSize=s[1]
   IDL> TV, image
   IDL> Cursor, x, y, /Down, /Device & Print, x, y
I did this a couple of times, trying to locate the very edge of the image itself. In the end, I decided there was a border of 24 pixels in the X direction and 30 pixels in the Y direction. So I re-sampled my image like this:
IDL> image = image[24:1227, 30:1219]
This was still a large image, so I decided to work with a window half this size. I placed the image in the window like this:
   IDL> s = Size(image, /Dimensions)
   IDL> Window, XSize=s[0]/2, YSize=s[1]/2
   IDL> TV, Rebin(image, s[0]/2, s[1]/2)
The next step, creating the map projection, is the hardest. This is obviously a satellite projection, I thought, so I looked up the on-line help for MAP_SET and started reading up on the Satellite map projection. I had never done a Satellite map projection before, so I made lots and lots of mistakes.
Here is more or less how I proceeded. First, there are some faint continental outlines on the original image, so I could see the image was centered about the Indian Ocean. I didn't know where. I opened another window, set up a Cylindrical map projection with continental outlines and grid markings on it, and clicked in it with the Cursor command to get a sense of what these values should be:
   IDL> Window, 1
   IDL> Map_Set, /Cylindrical, /Continents, /Grid, /Label
   IDL> Cursor, lon, lat, /Down, /Data & Print, lon, lat
The numbers came out something like longitude 64.35 and latitude 2.45. That gave me a general idea where I was. Then I grabbed an astronomy book off the shelf and I looked up how far geostationary satellites are from the Earth and the radius of the Earth, so I could specify where the satellite was with respect to the image I was looking at. My first attempt at a map projection, then, looked something like this:
IDL> Map_Set, 2.45, 64.35, /Satellite, SAT_P=[6.5,0.0,0.0], XMargin=0, YMargin=0, /NoErase
To see if I was anywhere close, I drew the continents on the map.
IDL> Map_Continents, Color=FSC_Color('red')
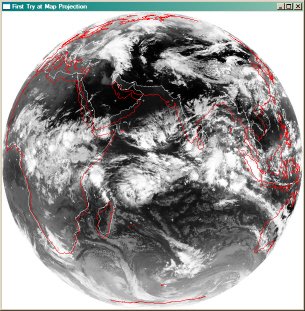
You see, in the figure below, what the results were. Notice that my continental outlines to not overlap the ones already there. I was in the right ball-park, but I was far from correct.
Eventually, I had to go do some more reading. I got back on the web page where I got the image, found the FAQ, and started reading. I learned that the satellite was positioned at 0 degrees latitude and 63 degrees longitude, and that geostationary images do not show the entire Earth. The horizon is about 65-70 degrees. That meant I needed the LIMIT keyword to tell my map projection where the left, top, right, and bottom of my image was located. Plugging various numbers into the LIMIT keyword of the MAP_SET command, I finally hit on values that I consided as good as it was going to get today. In this particular image, the horizon extends to about 68 degrees. Here is my final MAP_SET command:
   Map_Set, /Satellite, SAT_P=[6.5,0.0,0.0], XMargin=0, $
      YMargin=0, /NoErase, 0.0, 63, $
      Limit=[0.0, -5, 68.0, 63, 0.0, 131, -68.0, 63]
I judged the "accuracy" of my results by how closely my continental outlines overlapped those that were already on the image. These looked just about perfect.
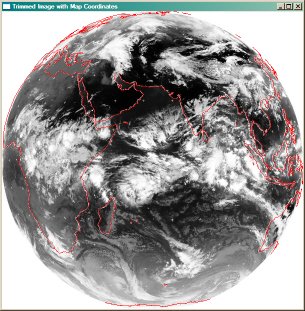
With the map coordinate system now in place, I can read the latitude and longitude coordinates off the image (say, with the CURSOR command), or I can overlay data on the image by simply using latitude and longitude values as my data coordinates.
You can find the code I used to play with the image on my web page. And you should also read Overlaying Geographic Data on GeoTiff Images to get a better understanding of these issues.
![]()
Last Updated 4 January 2007