
Overlaying Map Boundaries on MODIS Images
QUESTION: It was a dark night in a city that knows how to keep its secrets. But on the 12th floor of the Acme Building, one man is still trying to find the answer to life's persistent questions...Wily Coyote, Mapping Expert.
![]()
ANSWER: I'd just finished hammering the new sign up outside the office--Maps R Us: You Map It, We'll Locate It"--and was pulling the flask out of my back pocket, licking my lips over the thought of a long pull, when someone knocked on the door. "Yeah, come on in, it's open", I shouted.
I thought at first I had been blinded by a laser. But it was only the sun coming through the window behind me and reflecting off the sun medallion that hung around her neck like a beacon. She was young, mid-20s, dressed like a graduate student in a tight-fitting T-shirt that put me in mind of the mapping project I had just finished for the Forest Service in that National Park south of Yellowstone. Digital elevation maps, if you know what I mean. "Why, hello, Miss ..."
 "Mercator, Mr. Coyote" she said, in a voice that caused the hairs on the back of my neck to rise slowly.
"What can I do for you, Miss Mercator," I mumbled, slipping the flask into the top drawer of the desk.
She floated across the floor and slipped into the chair in front of my desk. She moved like a tennis player, like Roger Federer, maybe, or Ana Ivanovic tracking a short ball near the service line. She reminded me of that doubles partner I used to have before I made that unfortunate comment about not being able to concentrate on my backhand with her at the net.
"I have an easy problem for you to solve, Mr. Coyote," she whispered, and I knew immediately it was going to be a long night. "I want to overlay map boundaries on this MODIS image," she purred.
I'd been down this road before, many times, and it would only take me a couple of minutes to be done with business and then on to the more interesting parts of the evening. "What sort of MODIS image did you have in mind?," I asked her.
"This one," she said, sliding a memory stick across the table to me.
It was a standard issue MODIS Thermal Anomalies and Fire L3 product, gridded to a 1 kilometer grid, 1200 pixels square. Otherwise known as a "piece of cake" in the mapping business. "I think I can handle this," I said, having no idea yet how dangerous hubris was in the face of this woman.
"Uh, huh," I said, "Let me just find my glasses. Where did I put them?" The filename gave me some clues: MOD14A2.A2007145.h13v03.005.2007157162300.hdf. "Clearly, this is a MODIS tile, numbered 13 in the horizontal direction and 3 in the vertical direction," I said to her, firing up my browser while I did so. "Here, look at this," I said, swinging the monitor around so she could see it. "There's your image, right there," I said, pointing to tile h13v3.
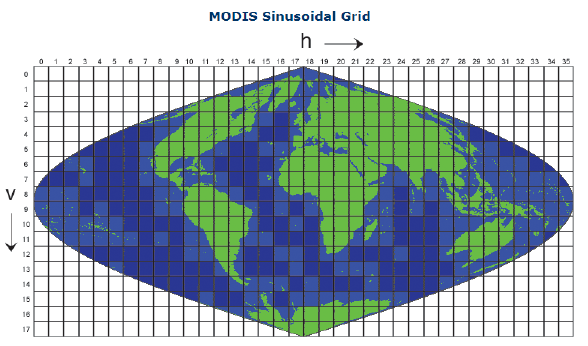 |
| The MODIS sinusoidal grid scheme. |
"But that's a sinusoidal grid," she mummered. "Mine's an integerized sinusoidal."
"But that's where you're wrong, Miss Mercator," I said, sweetly, having anticipated that she might be too young to know this. "NASA gave up on the integerized sinusoidal years ago, in collection three, and went strictly to the sinusoidal projection in collection four. Look at your file. This is collection five. It is not an integerized sinusoidal."
She looked at me with what I assumed was a great deal more interest than before.
"You're probably right," she said, offering a small smile.
"Let me show you how it is done, Miss Mercator", I said. "How do you feel about walking over to diner for a piece of pie while IDL is starting up? It will take a little while."
"I'd just as soon wait, Mr. Coyote, if it is all the same to you," she said, as we gazed at each other, drumming our fingers, while IDL went about its business, whatever that was.
"Fine, fine. OK, here it is--finally. Look at this now," I said, typing a few commands to open and read the fire product image out of the file. "If you don't have these commands, Miss Mercator, you can find them on Liam Gumley's web page. You should get them, they are extremely handy."filename = 'MOD14A2.A2007145.h13v03.005.2007157162300.hdf' hdfID = HDF_SD_START(filename) HDF_SD_VarRead, hdfID, 'FireMask', image HDF_SD_End, hdfID image = Reverse(image, 2)
"This is just so simple. Just be sure you reverse your image, because IDL always thinks up is down and visa versa. All we need to know are the latitude and longitude coordinates at the corners of the image," I said confidently, "and that information is available right here on this web page. See."
    iv = 3, ih = 13    LowerLeft ={-78.0057, 49.6796}
   UpperLeft ={-100.8, 59.9306}    LowerRight ={-61.9263, 49.7597}
   UpperRight ={-80.0236, 60.0982}
"Now, clearly, Miss Mercator," I lectured, "what we need are the sides of this rectangle, not the corners, and those are ever so easy to obtain. We just take the proper corners and find the latitude and longitude half way between. Look, we will type these commands."
    lslon = (-78.0057 + (-100.8))/ 2    lslat = (49.6796 + 59.9306) / 2
   tslon = (-100.8 + (-80.0236)) / 2    tslat = (59.9306 + 60.0982) / 2
   rslon = (-61.9263 + (-80.0236))/2    rslat = (49.7597 + 60.0982) / 2
   bslon = (-78.0057 + (-61.9263)) / 2    bslat = (49.6796 + 49.7597) / 2
"OK, with that information, it is easy to set up the sinusoidal map projection space and display our boundaries. Let me show you." I beamed at her while I typed.
   cgDisplay, 400, 400   TVLCT, cgColor('Dodger Blue', /Triple), 3
  TVLCT, cgColor('Indian Red', /Triple), 5   Position = [0,0,1,1]
  cgIMAGE, image, /KEEP, POSITION=position
  map = Obj_New('cgMap', 'Sinusoidal', /GCTP, SPHERE_RADIUS=6371007.181D, /OnImage)
  uv = Map_Proj_Forward([lslon, tslon, rslon, bslon], [lslat, tslat, rslat, bslat], $
      MAP_STRUCTURE=map->GetMapStruct())
  map -> SetProperty, XRANGE=[uv[0,0], uv[0,2]], YRANGE=[uv[1,3], uv[1,1]], /Draw
  cgMap_Continents, MAP_STRUCTURE=map, /HIRES   cgMap_Grid, MAP_STRUCTURE=map
"Now, where the hell did that graphics window go!?," I exclaimed, while searching for the window on my display. "It's here somewhere," I muttered to myself. "Ah, here it is," I said, a bit too loudly.
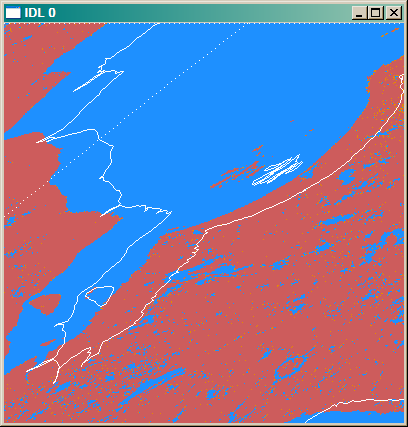 |
| Quick and dirty overlays on a sinusoidal MODIS grid. |
"Yes, I see, Mr. Coyote," she said, staring at me for a long time. Then she reached across my desk and pocketed her memory stick. "I'll see you around, Chump." And before I could offer even a word of explanation she was gone, leaving me with the same kind of headache I get on league nights, when I miss that open forehand down the line with the match tied in the third.
It wasn't until later, much later, that I realized what I had done wrong. "I shouldn't have gone for my glasses," I thought, but then I just sighed, "What the hell, I can't see anything without them, anyway."
Since I was wearing them now, I decided to read more about MODIS images. Clearly there was something I was missing. I found it on the MODLAND Tile Calculator web page.
It turns out that my way of calculating the sides of the image in this MODIS sinusoidal projection is in error. I assumed a linear interpolation, and this assumption was in error for this particular map projection. Thus, I was close, but with no cigar. But by using the Tile Calculator in the Inverse Mapping direction, I could calculate the sides of my image. Here are the values for the top, right, bottom, and left sides, respectively.
   vert tile 3  horiz tile 13  line 0.00  samp 600.00  =>  lat 59.995833  long -89.980333
   vert tile 3  horiz tile 13  line 600.00  samp 1199.00  =>  lat 54.995833  long -69.737894
   vert tile 3  horiz tile 13  line 1199.00  samp 600.00  =>  lat 50.004167  long -70.007157
   vert tile 3  horiz tile 13  line 600.00  samp 0.00  =>  lat 54.995833  long -87.156024
The values I should have used for the sides are these.
   tslon = -89.980333    tslat =  59.995833    rslon = -69.737894
   rslat =  54.995833    bslon = -70.007157    bslat =  50.004167
   lslon = -87.156024    lslat =  54.995833
With these values, I can issue the correct graphics commands.
  cgDisplay, 400, 400   TVLCT, cgColor('Dodger Blue', /Triple), 3
  TVLCT, cgColor('Indian Red', /Triple), 5   Position = [0,0,1,1]
  cgIMAGE, image, /KEEP, POSITION=position
  map = Obj_New('cgMap', 'Sinusoidal', /GCTP, SPHERE_RADIUS=6371007.181D, /OnImage)
  uv = Map_Proj_Forward([lslon, tslon, rslon, bslon], [lslat, tslat, rslat, bslat], $
      MAP_STRUCTURE=map->GetMapStruct())
  map -> SetProperty, XRANGE=[uv[0,0], uv[0,2]], YRANGE=[uv[1,3], uv[1,1]], /Draw
  cgMap_Continents, MAP_STRUCTURE=map, /HIRES   cgMap_Grid, MAP_STRUCTURE=map
And I see these results.
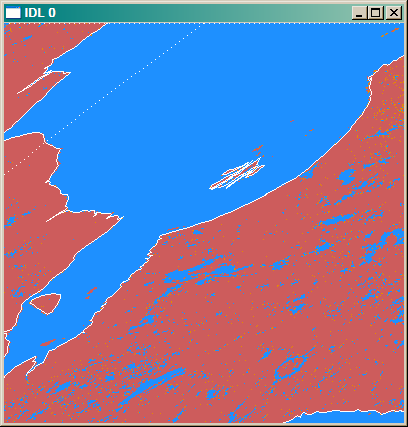 |
| Correct overlays on a sinusoidal MODIS grid. |
I'll be ready, I thought, if Miss Mercator ever returns.
![]()
Version of IDL used to prepare this article: IDL 7.0.3. My special thanks to Garrison Keillor of A Prairie Home Companion for literary license, and to Ana Ivanovic for tennis inspiration.
![]()
Copyright © 2009 David W. Fanning
Written 20 February 2009
Last Updated 20 November 2011