
Z-Axis Oddly Positioned
QUESTION: When I use the new graphics Surface function to produce a surface, the Z axis seems to be oddly positioned in the front of the surface plot, where it is almost always obscured by the data. It is possible to put this axis somewhere else?
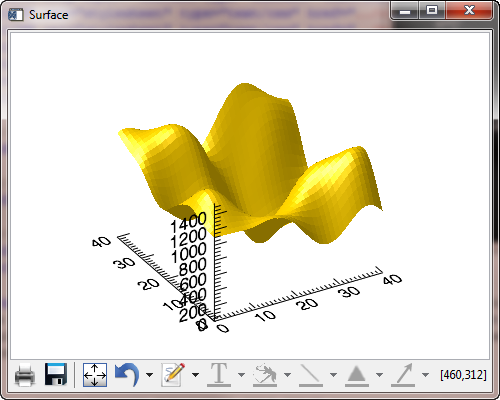 |
| The default surface plot axis placement. |
![]()
ANSWER: Yes, you can type code like this, which will move the axis to a more “normal” location.
    surf = Surface(LoadData(2))
  (surf['zaxis']).location = [(surf.xrange)[0], (surf.yrange)[1], 0.0]
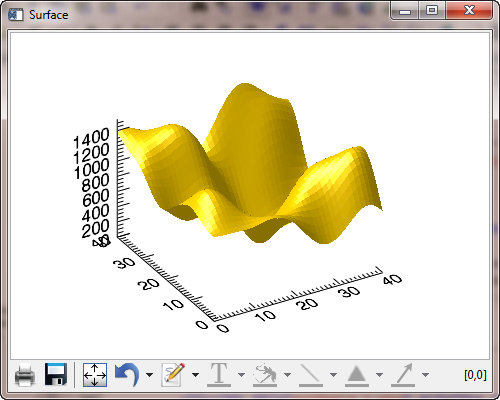 |
| The Z axis has been moved to a better position. |
![]()
Version of IDL used to prepare this article: IDL 8.0
![]()
Copyright © 2010 David W. Fanning
Last Updated 23 November 2010