
Reversing an Object Graphics Axis
QUESTION: I just simply want to reverse an axis in an object graphics program, and I am getting nothing but grief. I want my X axis to go from 40 to 0, instead of from 0 to 40. But no matter what I try, the axis annotation is backwards, or upside down, or a mirror image of what I want. What in the world is going on!?
![]()
ANSWER: This "simple" problem, fixed by reversing the X axis range in direct graphics, only took me four solid days of research to solve for object graphics. I think that is a new record for shortest-time-to-solve-a-simple-object-graphics-request. :-)
"How can something so simple, be so complex?", you ask. I don't know. I really don't know. But in addition to solving this problem, I also discovered a solution to another long-standing problem that has always annoyed me about object graphics plots: the X axis title is too close to the X axis annotation, at least compared to the position of the Y and Z axes. So here is the solution to both of these problems.
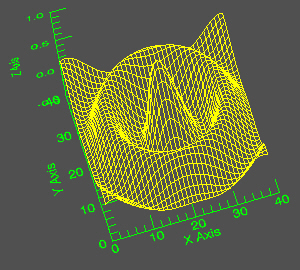
Here is a picture of how the X axis of a surface plot appears normally in object graphics.
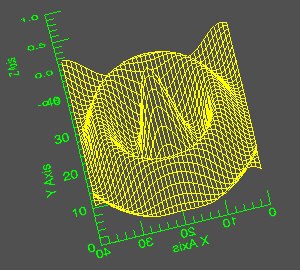
To reverse the X axis, the first thing you might try is simply to reverse the range vector when you are calculating the scaling and translation factors for the axis. I use the FSC_Normalize function for this purpose, but you can use whatever method you are familiar with and know how to use. In this case, the X axis extends from [-0.5,0.5] in the arbitrary coordinate system of the viewplane rectangle, so the first thing you try is something like this:
   xAxis->GetProperty, CRange=xrange
   xs = FSC_Normalize(Reverse(xrange), Position=[-0.5,0.5])
   thisSurface->SetProperty, XCoord_Conv=xs
   xAxis->SetProperty, XCoord_Conv=xs
But clearly this is not correct, as the results in the figure below demonstrate. The axis annotation is completely reversed.
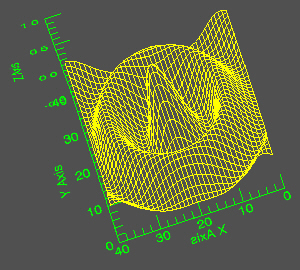
After spending several hours reading object graphics documentation, you find that a TextBaseLine keyword may help you out. At least it shows promise. You try it.
   xAxis->GetProperty, CRange=xrange
   xs = FSC_Normalize(Reverse(xrange), Position=[-0.5,0.5])
   thisSurface->SetProperty, XCoord_Conv=xs
   xAxis->SetProperty, XCoord_Conv=xs, TextBaseline=[-1, 0, 0]
The meaning of the TextBaseLine keyword is that the axis orientation should be oriented "anti-parallel to the X axis. In other words, reverse the text.
Hooray! Success. Well, partial success. The results are shown in the figure below. Everything is right now, except the axis title is still reversed.
After several more hours poking around in documentation and trying a variety of things, none of which work, you find that you can recover the title (as a text object) from the axis itself, and you find that a similar Baseline keyword is defined for this text object. You try that:
   xAxis->GetProperty, CRange=xrange, TickText=titleObject
   xs = FSC_Normalize(Reverse(xrange), Position=[-0.5,0.5])
   thisSurface->SetProperty, XCoord_Conv=xs
   xAxis->SetProperty, XCoord_Conv=xs, TextBaseline=[-1, 0, 0]
   titleObject->SetProperty, Baseline=[-1, 0, 0]
But, alas, you get the following error message:
% IDLGRTEXT::SETPROPERTY: The BASELINE property cannot be changed on
  IDLgrText objects in use by other objects.
In fact, you find out that many of the things you would like to do with the title object are impossible to do once the title object is part of the axis object. Eventually, innovation is motivated by despair, and you realize that the only way you are going to be able to solve this problem is to manipulate the axis titles yourself as text objects not connected to the axis objects.
But this leads to a second problem you were hoping you would never have to address: How do you figure out a robust, sure-fire method for locating axis titles next to axis annotation?
I'm not going to bore you with the details of this, because I don't want to embarrass the fine folks at RSI who struggle themselves to figure this system out (and who are always greatly helpful to me, I might add), but I have come up with a method. I admit it is ad-hoc. And I admit I don't completely understand how it works. I believe it is probably based on infomation that will change in future versions of IDL (beyond IDL 5.5). At least I hope so. :-) But beyond all that, the darn thing works.
Here is how I position the axis titles with respect to axis annotation. The variable ticklen defines the tick length for the plot. I've found it is a convenient spacing unit in my method. The numbers -0.5, 0.5, and 0 define the axis endpoints and middle in my arbitrary coordinate system. The Alignment keyword aligns the text about the midpoint of the axis, and the Location keyword places them in my arbitrary coordinate system. The text dimensions are "suppose" to be the dimensions of the block of text that is the axis annotation, in "data" coordinate units. (Don't look into this too deeply or you will fall completely into ruin! Take my word for it.) Basically, the titles are set off from the axis by the size of the axis annotations (in the direction I'm interested in), plus the length of a tick mark. This is 0.1 units in my 3D coordinate system.
   d = thisWindow->GetTextDimensions(xAxisText)
   xTitleObj->SetProperty, Location=[0, -0.5 - d[1]*1.5-ticklen, -0.5], $
      Alignment=0.5

   d = thisWindow->GetTextDimensions(yAxisText)
   yTitleObj->SetProperty, Location=[-0.5 - d[0]-ticklen, 0, -0.5], $
      Baseline=[0,1,0], UpDir=[-1,0,0], Alignment=0.5

   d = thisWindow->GetTextDimensions(zAxisText)
   zTitleObj->SetProperty, Location=[-0.5 - d[0]-ticklen, 0.5, 0], $
      Baseline=[0,0,1], UpDir=[-1,0,0], Alignment=0.5
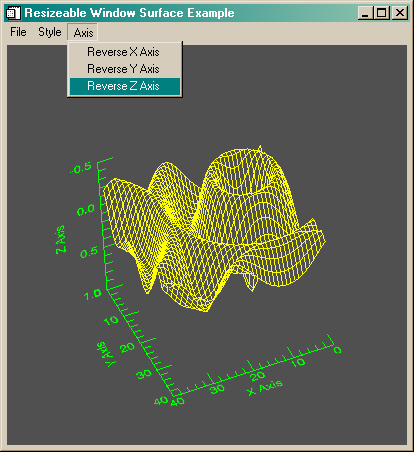
Here is how my method positions axis titles in an example program I wrote, named Reverse_Axes. Compare the X axis title to the X axis title in the top figure on this page. I think this method does a better job of locating this title.
Alright, so on to the meat of the problem, getting those axes reversed!
Well, it turns out that changing the text baseline vector only really works for the X axis. For the Y and Z axes, you leave the text baseline vector alone and you change the up direction vector that tells the text how to orient itself with respect to the baseline vector. The beauty of this method, of course, is that you don't have to worry at all about the axis titles, because they are oriented correctly from the beginning.
The relevant CASE statement for my reverse axis event handler in my example program Reverse_Axes looks like this. The info structure contains the information to run my program, including the object references I need here. The xstatus, ystatus, and zstatus fields are flags that tell me if the axis is currently reversed or not.
   CASE buttonValue OF

   'Reverse X Axis': BEGIN
      info.xAxis->GetProperty, CRange=range
      info.xstatus = 1-info.xstatus
      IF info.xstatus THEN BEGIN
         xs = FSC_Normalize(range, Position=[-0.5,0.5])
         info.thisSurface->SetProperty, XCoord_Conv=xs
         info.xAxis->SetProperty, XCoord_Conv=xs, TextBaseline=[1, 0, 0]
      ENDIF ELSE BEGIN
         xs = FSC_Normalize(Reverse(range), Position=[-0.5,0.5])
         info.thisSurface->SetProperty, XCoord_Conv=xs
         info.xAxis->SetProperty, XCoord_Conv=xs, TextBaseline=[-1, 0, 0]
      ENDELSE
      END

   'Reverse Y Axis': BEGIN
      info.yAxis->GetProperty, CRange=range
      info.ystatus = 1-info.ystatus
      IF info.ystatus THEN BEGIN
         ys = FSC_Normalize(range, Position=[-0.5,0.5])
         info.thisSurface->SetProperty, YCoord_Conv=ys
         info.yAxis->SetProperty, YCoord_Conv=ys, TextUpDir=[0, 1, 0]
      ENDIF ELSE BEGIN
         ys = FSC_Normalize(Reverse(range), Position=[-0.5,0.5])
         info.thisSurface->SetProperty, YCoord_Conv=ys
         info.yAxis->SetProperty, YCoord_Conv=ys, TextUpDir=[0, -1, 0]
      ENDELSE
      END

   'Reverse Z Axis': BEGIN
      info.zAxis->GetProperty, CRange=range
      info.zstatus = 1-info.zstatus
      IF info.zstatus THEN BEGIN
         zs = FSC_Normalize(range, Position=[-0.5,0.5])
         info.thisSurface->SetProperty, ZCoord_Conv=zs
         info.zAxis->SetProperty, ZCoord_Conv=zs, TextUpDir=[0, 0, 1]
      ENDIF ELSE BEGIN
         zs = FSC_Normalize(Reverse(range), Position=[-0.5,0.5])
         info.thisSurface->SetProperty, ZCoord_Conv=zs
         info.zAxis->SetProperty, ZCoord_Conv=zs, TextUpDir=[0, 0, -1]
      ENDELSE
      END

   ENDCASE
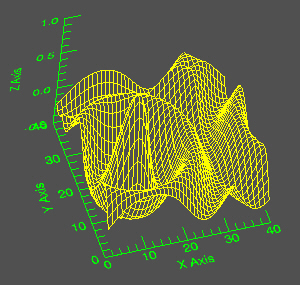
Here is an my example program, Reverse_Axes, showing all three axes reversed.
To run the example program, just do this:
IDL> Reverse_Axes
You can, of course, pass your own data, axis titles, etc. to the program in a manner similar to the Surface command.
   IDL> peak = LoadData(2)
   IDL> Reverse_Axes, peak, ZTitle='Elevation', XTitle='Longitude', YTitle='Latitude'
Please let me know if you find any problems when you use your own data. One problem with object graphics is that it can be more difficult than you wanted it to be to write general programs.
![]()
Copyright © 1997-2001 David W. Fanning
Last Updated 28 October 2001