
Creating a Contour Plot with Object Graphics
QUESTION: How do I go about creating a contour plot with a title using the new object graphics?
![]()
ANSWER: Object graphics requires that graphics plots be constructed from rather low-level primatives or graphic atoms, as RSI likes to call them. In practice, what this means is that you have to create all the axes, titles, and contour lines yourself and combine them to create a "view" of your data, which is what is displayed in the graphics window.
Contour plots are even harder to do in object graphics (and probably not even recommended), because the contour object RSI has supplied still has a few limitations. The most limiting is that the contour object does not permit users to label the contour lines with their value. The only way currently to differentiate contour levels is with color.
It is probably easier to show you a good example of how you might build a contour plot than it is to explain the process to you. Here is well documented example of a contour plot with a title. It is named XContour. You can download it by clicking here.
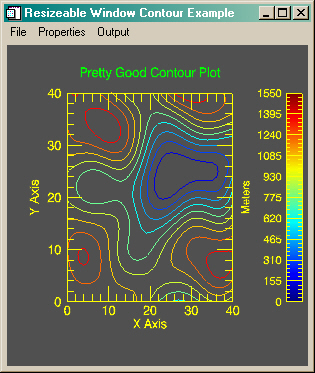
The XContour program can be used like the normal Contour program. The display window is resizeable. You can change some properties of the contour plot by using items in the Properties menu. The contour plot can be sent directly to a PostScript printer, or GIF and JPEG files can be created containing the window contents.
![]()
Here is a picture of what XContour looks like when it is running.
![]()
Copyright © 1997 David W. Fanning
Last Updated 29 June 1999