
Creating a Image Plot with Object Graphics
QUESTION: How do I go about creating a image plot with axes around it using the new object graphics?
![]()
ANSWER: Object graphics requires that all graphics plots be constructed from rather low-level primatives or graphic atoms, as RSI likes to call them. In practice, what this means is that you have to create all the axes, titles, and so forth yourself and combine them to create a "view" of your data, which is what is displayed in the graphics window.
It is probably easier to show you a good example of how you might build an image plot than it is to explain the process to you. Here is well documented example of a image plot with a title and axes around the image. It is named XImage. You can download it by clicking here.
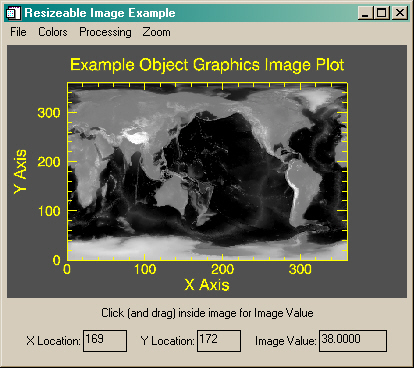
The XImage program can be used like the normal TV command. The display window is resizeable. You can change some properties of the image plot by using items in the Properties menu. The image plot can be sent directly to a PostScript printer, or GIF and JPEG files can be created containing the window contents. Note that the image aspect ratio is not preserved in this example program.
Note that to change image colors, you must also download the XCOLORS program.
![]()
Here is a picture of what XImage looks like when it is running.
![]()
Copyright © 1997 David W. Fanning
Last Updated 13 June 1997