Exaggerate the Z-Axis
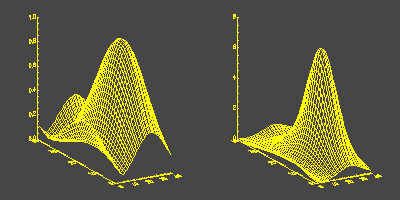
To exaggerate the Z-axis of a surface plot try multiplying your data by an exponential factor. Here is an example program that indicates what I mean.
   PRO EXAMPLE

      ; Create some data.

   peak = SHIFT(DIST(40),40/2+5, 40/2-5)
   peak = EXP(-(peak/15)^2)

      ; Open a window.

   WINDOW, /FREE, XSIZE=600, YSIZE=300

     ; Side-by-side plots.

   !P.MULTI = [0,2,1]

      ; Display the data.

   SURFACE, peak
   SURFACE, peak * EXP(peak * 2.0)

      ; Regular plotting.

   !P.MULTI = 0
   END
Your output should look like the display below.
![]()
Last Updated 2 December 1996

