
Forcing Exponential Axis Annotation
QUESTION: It seems that IDL has some kind of internal algorithm that sometimes selects exponential axis tick labeling and sometime selects number axis tick labeling. Can I force it to use exponential tick labeling all of the time?
ANSWER: You can create tick labels any way you like by using a special tick labeling function. The function is called by specifying the name of the function using the [XYZ]TickFormat keyword to a graphics command.
Here is a tick label function for forcing exponential axis labeling written by Stein Vidar Hagfors Haugan. Notice that the function is defined with three positional parameters. These are required for a tick formatting function.
   FUNCTION Exponent, axis, index, number

     ; A special case.
     IF number EQ 0 THEN RETURN, '0'

     ; Assuming multiples of 10 with format.
     ex = String(number, Format='(e8.0)')
     pt = StrPos(ex, '.')

     first = StrMid(ex, 0, pt)
     sign = StrMid(ex, pt+2, 1)
     thisExponent = StrMid(ex, pt+3)

     ; Shave off leading zero in exponent
     WHILE StrMid(thisExponent, 0, 1) EQ '0' DO thisExponent = StrMid(thisExponent, 1)

     ; Fix for sign and missing zero problem.
     IF (Long(thisExponent) EQ 0) THEN BEGIN
        sign = ''
        thisExponent = '0'
     ENDIF

     ; Make the exponent a superscript.
     IF sign EQ '-' THEN BEGIN
        RETURN, first + 'x10!U' + sign + thisExponent + '!N'
     ENDIF ELSE BEGIN
        RETURN, first + 'x10!U' + thisExponent + '!N'
     ENDELSE

   END
To see how it works, first try this command:
IDL> Plot, [1, 1e3]
And then try it with the tick formatting function, like this:
IDL> Plot, [1, 1e3], YTickFormat='exponent'
Here is an example that shows how the Y axis labels should appear
after typing the two commands above.
 |
| Example plot with and without EXPONENT function tick formatting. |
This function can even be used with logarithmic axes, like this:
IDL> Plot, [1,1e3], YTickFormat='exponent', YLog=1
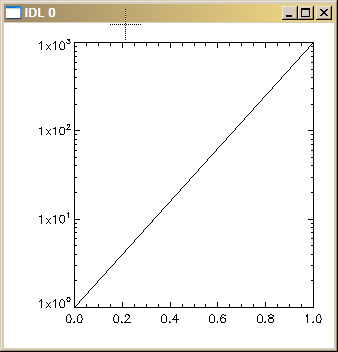 |
| The EXPONENT function can also be used with log plots. |
Paul van Delst has written a similar tick formatting function, that he describes in this IDL Newsgroup article.
![]()
Last Updated 21 December 2007