Irregular Tick Spacing and Values
QUESTION: How can I create a plot with irregular tick spacing and values?

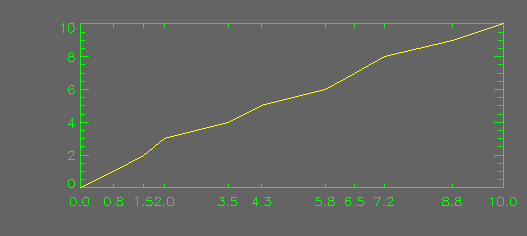
ANSWER: Irregular tick spacing on the axis of any graphic can be accomplished using a combination of the [XYZ]TickV and [XYZ]Ticks keywords. Here is an example in which irregular tick spacing is used along the X-axis of a line plot.
   x = [0.0, 0.8, 1.5, 2.0, 3.5, 4.3, 5.8, 6.5, 7.2, 8.8, 10.0]
   y = Findgen(11)
   Plot, x, y, XTickV=x, XTicks=10
Here is an example of a plot with irregular tick marks and spacing along the X axis.
![]()
Last Updated 8 September 1998

