
Overlaying an Image on a Map Projection
QUESTION: I have an image of precipitation data that covers the United States. Can you show me how to overlay this image onto a map projection? The image is scaled into 16 values that represent precipitation levels from 0 to 8 centimeters per hour.
![]()
ANSWER: You don't say what latitudes and longitudes your image covers, but this is essential information if you want to put it on the map projection properly. Since you say it covers the United States, I am going to assume that the lower-left corner of the image is at latitude 25 and longitude -130, and that the upper-right corner of the image is at latitude 50 and longitude -60. You can substitute your values for the ones in this example if these are not correct.
The first step is to create a window and set up the colors for displaying the image and the map projection. I would like the background to be gray and I would like to use other colors to display grid lines and state boundaries. I also need 16 colors to display the precipitation data. I like to use my GetColor program for selecting drawing colors. I might do something like this:
      ; Create a display window.

   Window, XSize=640, YSize=512, Title='Precipitation on 12 May 1999'

      ; Define colors.

   white = GetColor('white', 17)
   black = GetColor('black', 18)
   gray = GetColor('gray', 19)
   stateColor = GetColor('green', 20)
   gridColor = GetColor('yellow', 21)

      ; Load colors for display.

   !P.Background = gray
   !P.Color=white
   LoadCT, 33, NColors=16
   TVLCT, GetColor('gray'), 0 ; Zero precipitation same color as background.
The next step is to set up a map projection. We are going to limit the map projection to just the United States portion of the globe. Remember that when you use the Limit keyword that it is essential you also provide a centering longitude to the Map_Set command. The command might be written like this:
   Map_Set, 37.5, -95, Limit=[25,-130, 50, -60], $
      Position=[0.05, 0.05, 0.95, 0.8], /NoBorder
Nothing appears in your window yet, since all this command does is set up the map coordinate (or data) space. Note that the Position keyword is used to provide a bit of space at the top of the map projection for a color bar.
The next step is to warp this image into the map coordinate space. I am going to use the Map_Image command to do this because it is faster. Sometimes it is necessary, either because the data requires it or because you want a "smoother" look to the image, to use the Map_Patch command instead. The Map_Patch command takes a lot longer than the Map_Image command, but I think the results are more accurate. You will have to make the trade-off between speed and accuracy for your own application.
The command will look like this. Note that the xstart, ystart, xsize, and ysize parameters are all output parameters. These variables are filled with values by the Map_Image program. The image parameter is the precipitation image.
   warpedImage = Map_Image(image, xstart, ystart, xsize, ysize, $
      LatMin=25, LatMax=50, LonMin=-130, LonMax=-60, Missing=gray, Compress=1)
Note how the latitude and longitude extent of the image is indicated by keywords. In this example the image covers the entire extent of the map projection, but the map projection space could be (often is) larger than the image space. You will set both the map and image space according to the needs of your application.
It is also important to note that you do not strictly need the xsize and ysize parameters to view the map projection on the display. But you will never get proper PostScript output of an image on a map projection without them, so I never leave them out of this command. You never know when PostScript output will be required.
You are ready now to place the image on the map projection and to add continental and state boundaries, as well as latitude and longitude grid lines. The code might look something like this:
   TV, warp, xstart, ystart, XSize=xsize, YSize=ysize
   Map_Grid, Londel=5, Latdel=5, Color=gridColor
   Map_Continents, /USA, Color=stateColor
The final step is to add a color bar. I like to use the FSC_Colorbar program for this:
    FSC_Colorbar, NColors=16, Range=[0,8], Format='(F5.1)', Divisions=16, $
      Title='Precipitation (Cm / Hour)', Minor=1
The final results are shown in the graphic below.
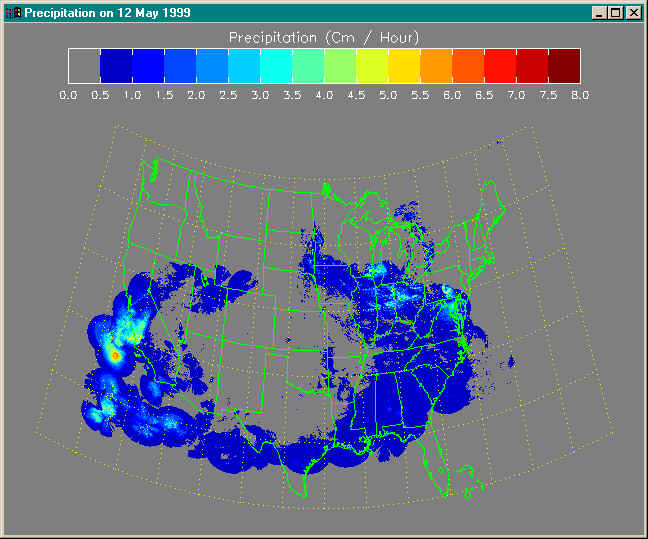
![]()
Copyright © 1997-1999 David W. Fanning
Last Updated 13 September 1999