
Overplotting Vectors in IDL
QUESTION: I am trying to plot a 2D vector field. I want a plot with arrows on it representing the magnitude and direction of the vector at that location. I've tried VELOVECT and PLOT_FIELD, but they both seem to require 2D vectors for the vector magnitudes and location and I have one element vectors for the vector magnitudes and locations. (Each point has an XY location and a UV magnitude, and is represented by a single index into these four vectors.) Short of gridding all my data to 2D arrays, is there any alternative? This seems like something IDL should provide.
![]()
ANSWER: Well, what "seems" likely is not always the case. :-(
And, there are other problems with VELOVECT and PLOT_FIELD besides the ones you mention. For example, they don't allow overplotting onto an already existing plot (such as a map projection) and they don't accept other PLOT keywords that you would sometimes like to use. The alternative many people use is the PartVelVec program from the NASA IDL Astronomy Library web page. It seems to be much more robust than the routines that come with IDL.
Here is code that shows you how to use PartVelVec to plot vectors on top of a contour plot.
    ; Create data to contour.
    data = cgDemoData(2)
    dims = Size(data, /Dimensions)
    x = cgScaleVector(Findgen(dims[0]), 0, 6)
    y = cgScaleVector(Findgen(dims[1]), 0, 10)

    ; Create data to plot as vectors.
    xloc = Randomu(seed, 40) * 4 + 1
    yloc = Randomu(seed, 40) * 8 + 1
    u = Randomu(seed, 40) *2
    v = Randomu(seed, 40) * 2

    cgContour, data, x, y, NLevels=12, Position=[0.15, 0.15, 0.90, 0.85]
    PartVelVec, u, v, xloc, yloc, /Over, VecColor='red'
You see the results in the figure below.
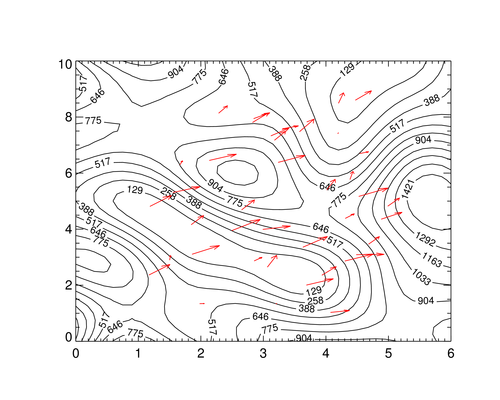 |
| A contour plot with vectors overlaid on top with PartVelVec. |
![]()
Coyote Vector Plotting Program
I have written my own vector plotting routine, based on PartVelVec, named cgDrawVectors. I was motivated by two factors. I wanted to make it easier to create a length legend for the vectors, and I wanted the vectors themselves to have more features. For example, I wanted to draw the vectors with solid arrow heads.
My program comes with two important keywords: ReferenceVectorand Length. This allows you to easily create a legend or key for your program so users can see what the length of a vector actually refers to. The ReferenceVector keyword is set to the magnitude of a vector that is used to scale the magnitudes of all other vectors. In other words, all vectors are scaled according to the reference vector. The Length keyword is used to define the length of the reference vector in normalized units (the normalized width of the graphics window). This makes it possible to define a reference key for your vector plot.
    cgDisplay
    referenceVector = 5 ; Meters
    length = 0.1        ; O.1 normalized X units in the graphics window
    cgArrow, 0.45, 0.5, 0.55, 0.5, /Normal, Color='red', Thick=3, /Solid
    cgText, 0.5, 0.45, Alignment=0.5, /Normal, '5 meters', Color='red'
Here is the plot above, created with cgDrawVectors.
    cgContour, data, x, y, NLevels=12, Position=[0.15, 0.15, 0.90, 0.85]
    hsize = !D.X_Size/64.
    cgDrawVectors, u, v, xloc, yloc, /Overplot, VecColor='red', $
      /Solid, ReferenceVector=5.0, Length=0.1, HSize=hsize
    cgArrow, 0.15, 0.875, 0.25, 0.875, /Normal, Color='red', /Solid, HSize=hsize
    cgText, 0.27, 0.87, /Normal, '5 meters', Color='red', Font=0
You see the result below.
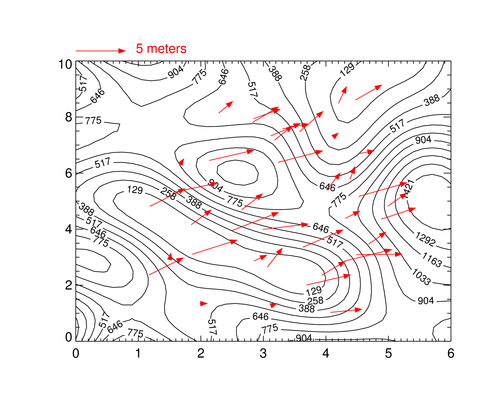 |
| A contour plot with vectors overlaid on top with cgDrawVectors. |
You can find additional code to create velocity vector plots in the Coyote Plot Gallery. Here is an example of a plot you can find there.
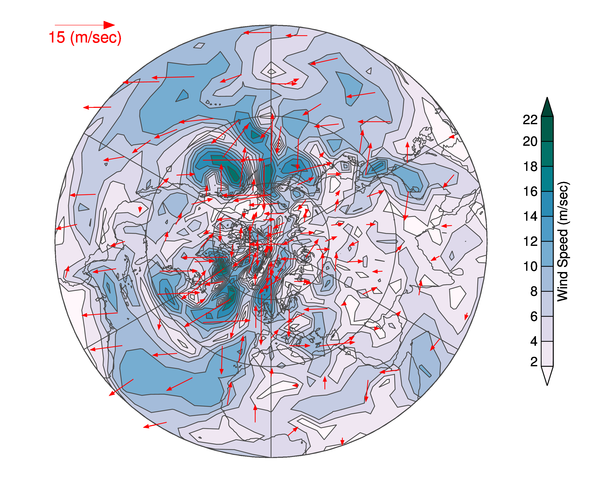 |
| Code for this velocity vector plot can be found in the Coyote Plot Gallery. |
![]()
Written 14 March 2005
Updated 22 March 2014