
Creating Color Filled Contour Plots
QUESTION: My filled contour plot colors look fabulous when I am viewing the plot on the display. But when I send the same plot to a color PostScript file, the last three contours are shown in gray-scale colors. What is going on?
![]()
ANSWER: The answer to this arises from the different number of colors available to you on your display and in a PostScript file, and from the way you are choosing your filled contour colors. My guess is that your filled contour plot commands look something like this. (If you would like to run the code below on your machine, you will need the cgDemoData, cgScaleVector, and cgColorbar programs from my web page.)
Editor's Note: Almost all problems with contour plots can now be solved by using the Coyote Graphics routine cgContour to display your contour plots.
![]()
   ; Set up the data filled contour plot.
   data = cgDemoData(2)
   x = cgScaleVector(Findgen(41), 0, 100)
   y = cgScaleVector(Findgen(41), 0, 50)

   ; Set up the contour levels. MUST do this for filled contours
   ; to be accurate!
   levels = 12
   step = (Max(data) - Min(data)) / levels
   userLevels = IndGen(levels) * step + Min(data)

   ; Load colors.
   Device, Decomposed=0
   LoadCT, 5

   ; Issue  the contour commands.
   Window, 0, Title='Display Output', XSize=300, YSize=400
   Contour, data, x, y, /Fill, Position=[0.1, 0.1, 0.9, 0.80], $
      Levels=userLevels, Color=!P.Background, Background=!P.Color
   Contour, data, x, y, /Overplot, Levels=userLevels, /Follow, Color=!P.Background
   cgColorbar, Divisions=6, Range=[Min(data), Max(data)], Format='(I4)', $
      Position = [0.1, 0.9, 0.9, 0.95], Color=!P.Background
![]()
The result of typing these IDL commands is shown in the illustration on the left, below. The filled contour plot looks just like you expect it to look. However, when you select the PostScript graphics device and re-issue just the contour commands shown above, your results look more like the illustration on the right. What has gone wrong?

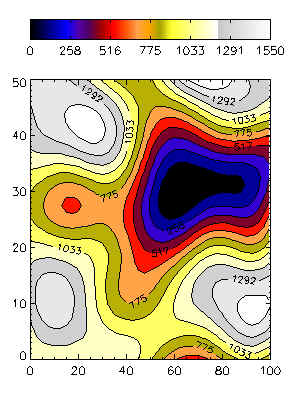
You have two or three problems here, but your biggest problem is that you have 256 colors avaiable to you in your PostScript device, but fewer than that available to you on your display device. To see how many you have on your display, type this:
IDL> Print, !D.Table_Size
I'm going to guess this number is something like 200.
Now, when you load a color table in IDL, the 256 values in the color table vectors are re-sampled into the number of colors you have in your IDL session. So in effect, when you loaded color table 5 in the code above, you were loading the first 200 colors in your display color table. When you switch to a PostScript device, these colors are copied over into PostScript. But, PostScript has 256 colors. So in the PostScript color table, the first 200 colors have your color table 5 colors and the last 56 have the default gray-scale colors.
You get into these gray-scale colors because of the way you allow IDL to select the filled contour color indices for you. You use the keyword Fill, but you don't use the keyword C_Colors to tell IDL the indices of the colors it should use for the filled contours. What it does in the absence of this information is sample the color table in approximately equal-spaced intervals and use these numbers for the indices.
So, in the first instance IDL uses 12 values ranging from 0 to 200, and in the second instance IDL uses 12 values ranging from 0 to 256. Clearly, the last three of these values are greater than 200, so you are using gray-scale colors.
What can you do? Well, you have a couple of choices. One choice is that you can reload the color table once you get into the PostScript device, just by issuing the LoadCT command before you draw your contour plot. This works, but what you might notice is that the color indices choosen on your display are just slightly different from the color indices choosen in your PostScript file. Why? Yes, you guessed it. Because there are a different number of colors, so the color spacing will be different.
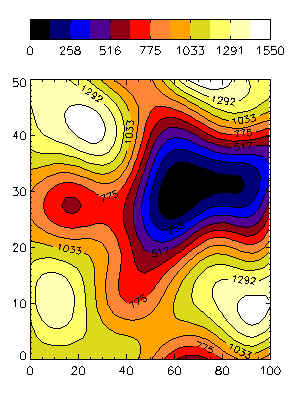
A better solution is to choose the color index numbers yourself, and make them exactly the same both for your display and for your PostScript output. These color indices are selected by using the C_Color keyword. Your code might look like this:
![]()
   ; Set up the data filled contour plot.
   data = cgDemoData(2)
   x = cgScaleVector(Findgen(41), 0, 100)
   y = cgScaleVector(Findgen(41), 0, 50)

   ; Set up the contour levels. MUST do this for filled contours
   ; to be accurate!
   levels = 12
   step = (Max(data) - Min(data)) / levels
   userLevels = IndGen(levels) * step + Min(data)

   ; Load colors.
   Device, Decomposed=0
   LoadCT, 5, NColors=12, Bottom=3

   ; Issue  the contour commands.
   Window, 0, Title='Display Output', XSize=300, YSize=400
   Contour, data, x, y, /Fill, Position=[0.1, 0.1, 0.9, 0.80], $
      Levels=userLevels, Color=!P.Background, Background=!P.Color, $
      C_Colors=IndGen(levels) + 3
   Contour, data, x, y, /Overplot, Levels=userLevels, /Follow, Color=!P.Background
   cgColorbar, Divisions=6, Range=[Min(data), Max(data)], Format='(I4)', $
      Position = [0.1, 0.9, 0.9, 0.95], Color=!P.Background, $
      NColors=12, Bottom=3
![]()
The result of these commands looks identical both on the display and in the PostScript file. You see an example of the output in the illustration below:
You can find out why you should always create your own contour intervals in filled contours, by reading the Holes in Filled Contour Plots article on this web page.

Last Updated 5 April 1999