
Coyote Graphics System (CGS) Commands
QUESTION: What in the world is the Coyote Graphics System (CGS) I am hearing so much about!?
![]()
ANSWER: The Coyote Graphics System (CGS) is a collection of Coyote Library programs that turn the traditional IDL graphics commands (e.g., Plot, Contour, Surface, TV, etc.) into modern programs that duplicate the device independence, color model independence, and functionality (including resizeable graphics windows) of the latest “new” graphics system in IDL. Best of all, this functionality is available in any version of IDL. Coyote Graphics code is available in the Plot Gallery for over 50 different types of IDL graphics plots, including line plots, contour plot, image plots, and many more.
The Coyote Graphics System is explained in my most recent book, Coyote's Guide to Traditional IDL Graphics. Please have a look at what people are saying about the book and the Coyote Graphics System. Here is what one user had to say about the Coyote Library.
I am coming from the java/python/etc world and I am now in a group that is all IDL all the time. It seems, in general, to be a very powerful language that can do a ton of really cool stuff, but it seems like IDL has this massive inertia that resists any sort of fundamental change. As a result, the syntax is stuck in the 1970s and it is very hard for someone used to modern syntax to get used to some of IDL’s “features.” To this end, I really appreciate having this library of functions that removes many of the nuances of IDL and gives me an interface that works the way I expect it to.
The most important features of Coyote Graphics System are these:
- The commands work identically on the display, in PostScript, and in the Z-graphics buffer.
- The commands can be displayed automatically in resizeable graphics windows.
- The commands automatically create high quality PostScript, PDF, and raster file output.
- CGS graphics visualizations can be saved and restore later, or e-mailed to colleagues.
- The commands work identically in an indexed or decomposed color environment.
- The commands can use colors by name (e.g., "red", "dodger blue").
- CGS commands are faster (often much faster) than the equivalent IDL function graphics commands.
- Greek letters and other symbols can be directly embedded in Coyote Graphics text.
- The commands fix the most annoying quirks (e.g., contour holes and levels) in traditional IDL commands.
- The Coyote Plot Gallery contains code and examples of over 50 different graphics plots.
- The Coyote Graphics System Library continues to grow as more people use these commands.
![]()
Coyote Graphics System Programs
The Coyote Graphics System really makes use of all the programs in the Coyote Library, but here are short descriptions of the programs that belong specifically to the CGS system.
Primary Graphics Programs
- cgColor -- The granddaddy of device independent
graphics programs, cgColor allows you to ask for colors by name, a fundamental property of all the
graphics programs described below. If you want to learn the names of the 200 colors you can use, type
this command.
color = cgPickColorName()
- cgImage -- This
command is a wrapper for the TV and TVScl commands. You don't have to use this command, but you do have
to use a TV alternative command. Nothing in IDL will hold you back more from
improving your programming skills than the TV command.
I haven't used a TV command in 15 years, and you shouldn't
be using it either.
Among the many features of the cgImage command are these:
- Works identically on the display, in PostScript files, and in the Z-buffer
- Is color model independent
- Displays 2D, true-color, and alpha-channel images in correct colors
- Allows images to be positioned with the POSITION keyword
- Honors the !P.MULTI system variable
- Images can be created with axes
- A image coordinate system can be established with XRANGE and YRANGE keywords
- Automatically scales images with values less than 0 or greater than 255
- Has 10 different contrast enhancement stretches for image display
- Protects image colors
- Allows color tables to be selected with the CTIndex and Palette keywords
- Allows overplotting of images onto a data or map coordinate system
- Can read and display images directly from a file.
- Works well with the map coordinate object, cgMap, for georegistered images
- Allows semi-transparent images to be overlaid on existing images
- Allows output directly to PostScript and raster files (e.g., PNG, JPEG, TIFF, etc.)
The program is designed to play well with other Coyote Graphics commands.
   image = cgDemoData(18)
   cgImage, image, Margin=0.025, /Axes, CTIndex=4, /Brewer, /Reverse
   cgContour, image, Color='black', /OnImage

cgImage is a wrapper for the TV command. One of the nicest features of cgImage is the ability to use it with !P.Multi or cgLayout to produce multiple-image plots.
   head = Reverse(cgDemoData(8), 2)
   s = Size(head, /Dimensions)
   cgLoadCT, 0
   cgDisplay, 9*s[0], 6*s[1]
   !P.Multi = [0, 9, 6]
   !X.OMargin = [0, 25]
   !Y.OMargin = [0, 8]
   FOR j=0,53 DO cgImage, head[*,*,j], Background='white', MultiMargin = 0.25
   !P.Multi = 0
   cgColorbar, /Vertical, Range=[0,10], Format='(F0.2)', $
       Position=[0.94, 0.15, 0.97, 0.80]
   cgText, 0.45, 0.95, 'MRI Study of the Head', /Normal, Alignment=0.5
   !X.OMargin=0 & !Y.OMargin=0
cgImage can be positioned with the Position keyword and with !P.Multi. - cgPlot -- This is a wrapper for both the Plot and OPlot commands.
It differs from both in that you can set both the color of the data (with the Color keyword) and the color
of the axes, titles, and other plot annotation (with the AxisColor keyword), as well as the
color of the symbols (with the SymColor keyword). To overplot on a set of axes
established by another command, set the OverPlot keyword. Another new feature of this command is that you
can use the Aspect keyword to select a particular aspect ratio (height/width) of the plot. And, like most
Coyote Graphics commands, you can send the command directly to a PostScript, PDF, JPEG, PNG, etc. file
with the Output keyword. Here is an
example of the command in action. Users can use all 46 symbols allowed
by cgSymCat,
rather than just the eight allowed by the Plot command.
   data = cgDemoData(1)
   cgPlot, data, COLOR='red', Aspect=2./3, XTitle='Time', $
       YTitle='Signal', PSym=-46, SymColor='grn6', SymSize=2
   cgPlot, !X.CRange, [15,15], LineStyle=2, Color='blue', /Overplot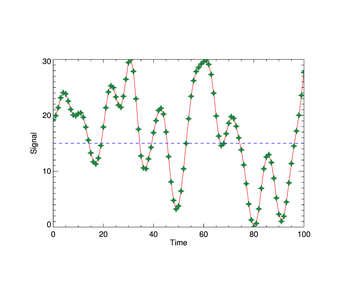
cgPlot is a wrapper for both the Plot and OPlot commands. To display this or any other CGS command in a resizable graphics window, simply set the Window and/or AddCmd keywords.
   data = cgDemoData(1)
   cgPlot, data, Color='red', Aspect=2./3, XTitle='Time', $
       YTitle='Signal', PSym=-46, SymColor='grn6', SymSize=2, /Window
   cgPlot, !X.CRange, [15,15], LineStyle=2, Color='blue', /Overplot, /AddCmd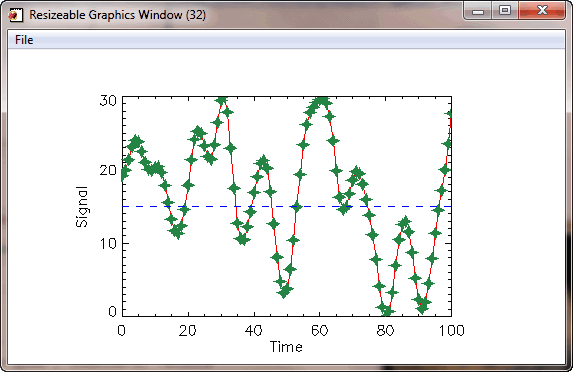
Plot and OPlot command can be displayed in resizeable graphics windows. - cgContour -- This is a wrapper for the Contour command.
It fixes a number of problems with the traditional Contour
command, including producing the correct number of contours when the NLevels keyword is used, and properly
filling the contour hole in contour plots. A new Label keyword makes it easy to label contour levels. It
will easily overlay contours on images, if the images are displayed with cgImage.
To display this command in a resizable graphics window,
set the Window keyword. To send the output of the command directly to a PostScript, PDF, JPEG, PNG, or TIFF
file, use the Output keyword.
   data = cgDemoData(2)
   LoadCT, 33, NColorS=12, Bottom=1
   cgContour, data, /Fill, NLevels=12, Position=[0.125,0.125,0.9,0.75], C_Colors=Indgen(12)+1
   cgContour, data, /Overplot, Color='black'
   cgColorbar, Range=[Min(data), Max(data)], Divisions=12, NColors=12, Bottom=1, $
       Position=[0.125, 0.87, 0.9, 0.94], /Discrete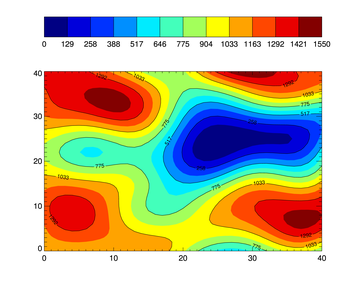
cgContour is a wrapper for the Contour command. - cgSurf -- This is a wrapper for both the Surface
and Shade_Surf commands. (Although, for convenience, you can use the cgShadeSurf command to create
shaded surfaces.) The title is put onto the surface flat-to-the-screen, rather than
rotated in the traditional Surface fashion. To display this command in a resizable graphics window,
set the Window keyword. To send the output of the command directly to a PostScript, PDF, JPEG, PNG, or TIFF
file, use the OUTPUT keyword.
   data = cgDemoData(2)
   cgLoadCT, 0
   cgSurf, data, /Shaded, Shades=BytScl(data)
   cgLoadCT, 25, /Brewer, /Reverse
   cgSurf, data, Shades=BytScl(data), /NoErase, Title='Surface Title'
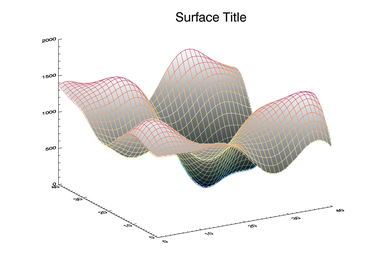
cgSurf is a wrapper for both the Surface and Shade_Surf commands. - cgSurface -- As nice as
cgSurf is, it still
suffers from limitations imposed on the Surface command. In particular, the Surface command
is not a true 3D command, since the surface cannot be rotated around all three axes. You need
to move to the object graphics system, which is a true 3D system, to obtain this functionality.
But the object graphics surface commands offered by Excelis (iSurface or the new Surface function
in IDL 8) seem clunky and unintuitive to me. For one thing, the Z-axis is always
in the wrong place when the commands start up. cgSurface is
a non-traditional traditional graphics command that is meant to
complement these other traditional commands.
I use it when I truly want to see what my surface looks like. It comes in a resizeable graphics window and
the surface can be rotated with the mouse around all three surface axes. The Middle and Right buttons zoom
into and out of the surface. Clicking on the surface axes will allow the user to move or translate the surface, and
clicking on the plot title will allow the user to move the title. You can save the
surface as JPEG, PNG, TIFF, or PostScript files. You have complete control over the four lights that
illuminate the surface, and you can drape any 2D or true-color image on top of the surface.
   data = cgDemoData(2)
   cgLoadCT, 33
   cgSurface, data, /Elevation_Shading, /Shaded, Title='Elevation Shading'
   cgSurface, data, Title='Texture Mapping Example', Texture_Image=cgDemoData(16), ZScale=0.5
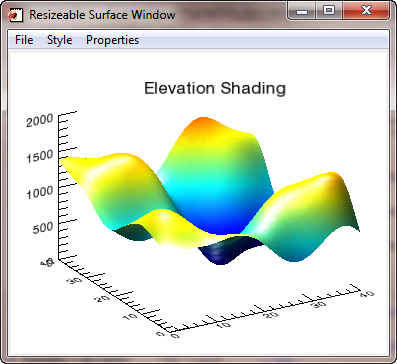
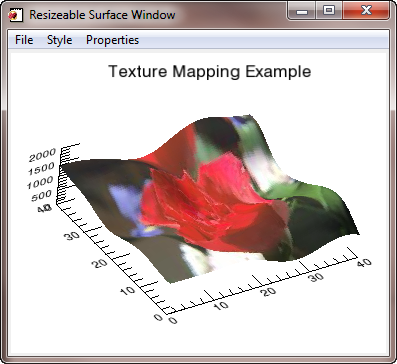
cgSurface is a non-traditional traditional command for interacting with surfaces. - cgPlotS -- This command is a wrapper
for the PlotS command.
Data colors (Color keyword), symbol colors (SymColor keyword), and symbol
sizes (SymSize keyword) can all be
vectors. This allows you to draw plots with multicolored lines, multicolored symbols, and/or multisized symbols.
   data = cgDemoData(1)
   time = cgScaleVector(Findgen(101), 0, 6)
   LoadCT, 33, /Silent
   cgPlot, time, data, /NoData, XTitle='Time', YTitle='Signal'
   cgPlotS, time, data, PSym=-16, Color=BytScl(data), $
           SymColor=BytScl(data), SymSize=cgScaleVector(data, 1.0, 2.5)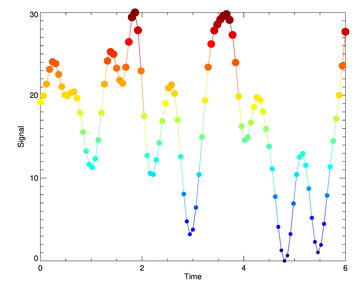
cgPlotS is a more powerful alternative to PlotS. - cgLegend -- This command adds
a legend to an IDL graphic display.
   cgPlot, cgDemoData(17), PSym=-15, Color='red', YRange=[0,140], $
       LineStyle=0, YStyle=1
   cgPlot, cgDemoData(17), PSym=-16, Color='dodger blue', /Overplot, $
       LineStyle=2
   cgLegend, Title=['Experiment 1', 'Experiment 2'], PSym=[-15,-16], $
       SymSize=2, Color=['red','dodger blue'], Location=[50,130], /Data, $
       /Center_Sym, LineStyle=[0,2], VSpace=2.0, /Box, Alignment=4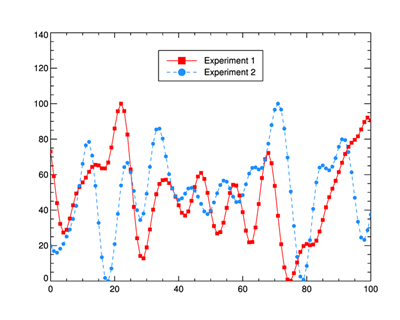
Legend Centered about Location Point - cgColorbar and cgDCbar-- These commands produce continuous and discrete color bars, respectively. See Adding a Colorbar for additional information about color bars.
Other Graphics Programs
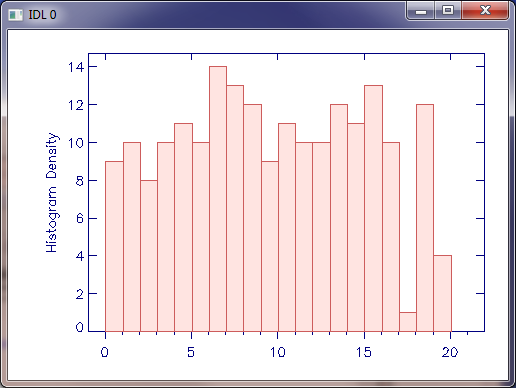
- cgHistoPlot -- This command displays a histogram.
See Creating a Histogram Plot for additional information.
A histogram plot with cgHistoplot. - cgBarPlot -- This command displays a bar plot.
See Creating a Bar Plot for additional information.
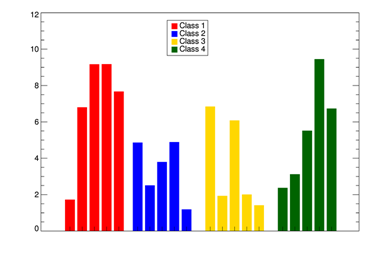
Four data sets displayed side-by-side in a bar plot. Error bars can be added to bar plots with the cgPlot command.
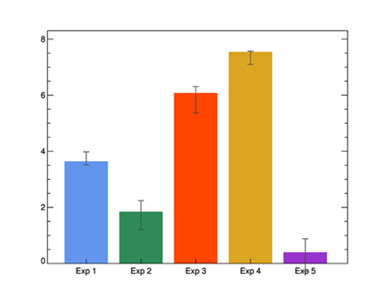
Error bars added to a bar plot. - cgBoxPlot -- This command displays a box plot.
See Drawing a Box and Whisker Plot for additional information.
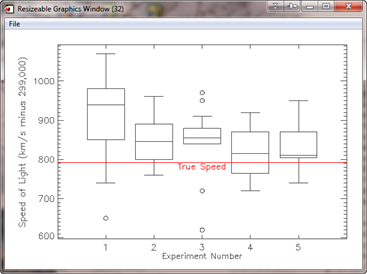
A box and whisker plot in IDL. - cgZPlot -- This command produces a line plot that can be zoomed and panned
by the user. I developed it to see Lidar data (which can be massive!)
at user-definable resolutions.
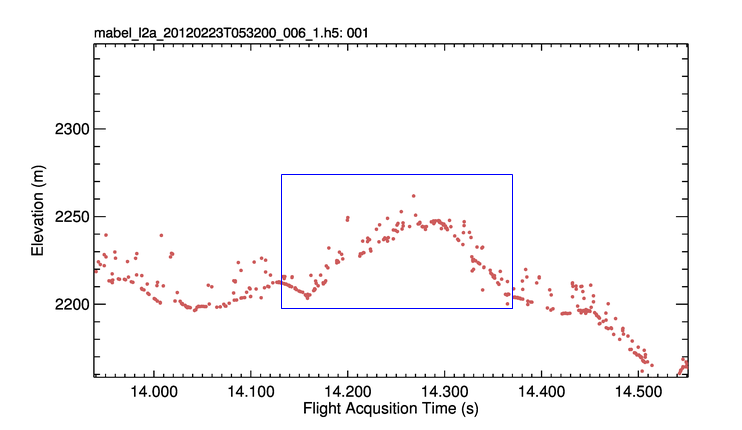
Lidar data shown in a cgZPlot zoom/pan plot.
Graphics Utility Routines
- cgAxis -- This command draws an axis in the display window and is a wrapper for the Axis command.
- cgDefCharSize -- This utility routine calculates default character sizes for Coyote Graphics routines. The character size depends on the operating system you are using, the current font value, and the state of the !P.Multi system variable. It's purpose is to make character sizes large enough to be read easily and to make Coyote Graphics routines look more like the IDL 8 function graphics routines. Default character sizes are only used if !P.Charsize is set to its default value of 0.
- cgLoadCT -- A beefed-up LoadCT. Brewer color tables as well as IDL color tables can be loaded, reversed, clipped, etc. Set the Window keyword to change the cgWindow color tables.
- cgPolygon -- This command creates a filled or unfilled polygon on the display.
- cgSymCat -- This is a symbol catalog for 46 different plotting symbols you can use with cgPlot and other commands. It allows you to ask for a symbol by name (e.g, PSYM="Open Square") or by index number (e.g, PSYM=15).
- cgSymbol -- This command allows you to use Greek (φ, ξ, λ, etc.) and other symbols (Å, ≠, ≡, etc.) in your IDL programs. The symbols produced will work correctly on the display and in a PostScript file. See the article Using Greek Symbols for additional information.
- cgSnapshot -- This command allows you to take a snapshot of a graphics window. It is the equivalent to the TVRD command in IDL. It can be used to automatically create color raster file output in any of five different raster file formats.
- cgText -- This command is a wrapper for the XYOutS command. Colors can be expressed by name and the text can be placed in a graphics window interactively, using the cursor, if the Placekeyword is set. If the color is undefined the text is automatically written in a color "opposite" to the background color for maximum contrast.
- XColors -- A functional XLoadCT. Brewer color tables as well as IDL color tables can be loaded, reversed, clipped, etc. Set the Window keyword to change the cgWindow color tables.
Graphics Window Routines
- cgDisplay -- This command is a wrapper for
the Window command.
Colors can be expressed by name. The default erase color is "white" to accommodate these graphics commands.
This command can be used in programs that are meant to work on the display and in devices that do not support
windows by "protecting" the Window command from the latter devices. In other words, before in such programs
you had to write code like this.
IF (!D.Flags AND 256) NE 0 THEN Window, 1, XSIZE=400, YSIZE=500
Now, you can just write code like this.
  cgDisplay, 1, 400, 500
  cgDisplay, XSIZE=600, YSIZE=600, /FREE, Color='gray'
The Window command is protected automatically. In a PostScript file, the command acts to create a "window" with the same aspect ratio as the current graphics window. This makes is extremely easy to produce PostScript output that looks virtually identical to your display output. In the Z-graphics buffer, the command sets the resolution of the Z device to match the size of the current graphics windows.
- cgWindow -- This command is a resizeable graphics
window for displaying IDL graphics commands. In addition to resizing the graphics window, this command can create
BMP, GIF, JPEG, PNG, TIFF raster files, as well as true PostScript and PDF output. Any Coyote
Graphics routine that sets a Window keyword will be displayed in an cgWindow
application. This makes it possible to use this resizeable, smart graphics window in
a fashion that is identical to how normal IDL graphics windows are used.
Use cgSet, cgShow and
cgDelete to manipulate
cgWindow applications.
The cgWindow program can accept multiple graphics commands. Commands can be added, deleted, replaced, and listed. Multiple cgWindow programs can be opened at once, and you have easy access to the commands in any graphics window. Here is an example of how to display a filled contour plot with a color bar.
   cgLoadCT, 4, /Brewer, /Reverse, NColors=12, Bottom=1
   data = cgDemoData(2)
   cgContour, data, NLevels=12, /Fill, C_Colors=Indgen(12)+1, $
              Position=[0.1,0.1,0.9,0.75], /Outline, /Window
   cgColorbar, Divisions=12, Range=[Min(data), Max(data)], NColors=12, $
            Bottom=1, XMinor=0, XTicklen=1.0, /AddCmd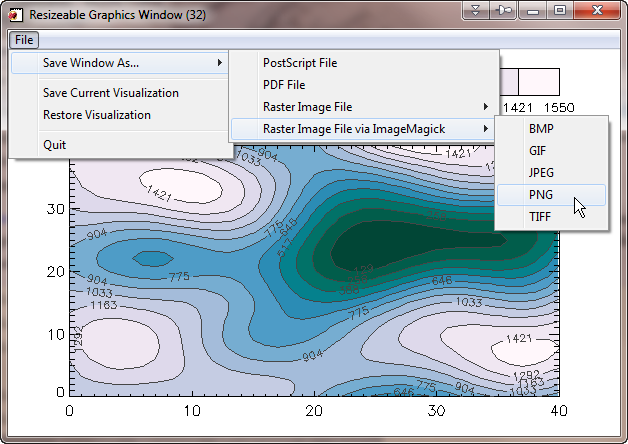
cgWindow allows multiple commands that can be moved and edited. To change colors in an cgWindow display, use cgLoadCT or XColors with the Window keyword set. The WinID keyword can select which cgWindow, based on window index number, to apply the colors to. Otherwise, the current cgWindow colors are changed.
   cgLoadCT, 33, /Window
   XColors, /Window
The current commands in a cgWindow (the visualization) can be saved to a file, e-mailed to a colleague so he or she can be looking at the same visualization you are, and restored whenever you like. Simply use the Save Visualization and Restore Visualization buttons under the File menu on the interface.
- cgQuery -- This command allows you to gather information about all the cgWindow applications currently on the display. Information includes window index numbers, the widget identifiers of the top-level base widgets, the window titles, or the window's object references. Set the Currentkeyword to get similar informaton for just the current cgWindow.
- cgControl -- This command allows you to set various global and local properties of the graphics window. For example, you can turn window updating on or off, change the parameters for how PostScript files are created, and even create PostScript, PDF, and raster files programmatically..
- cgDelete -- This command allows you to delete any or all cgWindow applications on the display. It is the equivalent to the WDelete command in IDL.
- cgErase -- This command is a wrapper for the Erase command.
Colors can be expressed by name. The default erase color is "white" to accommodate these graphics commands. Set the Window keyword to erase an cgWindow and delete all of its
display commands.
cgErase, 'gray'
- cgSet -- This command allows you to make an cgWindow application the "current" display window. It is the equivalent to the WSet command in IDL.
- cgShow -- This command allows you to bring an cgWindow application forward on the display. It is the equivalent to the WShow command in IDL.
- cgWindow_SetDefs -- This utility routine sets the default "values" for the window. Configure your PostScript and ImageMagick output, turn resizeable text sizing on or off, set the background color for the window, and set many other options.
- cgWindow_GetDefs -- This utility routine returns the default "values" for the window.
Graphics Output Routines
   cgPS_Open, Filename='coyote_graphics.ps'
   data = cgDemoData(2)
   cgLoadCT, 33, NColors=12, Bottom=1
   cgContour, data, /Fill, NLevels=12, Position=[0.125,0.125,0.9,0.75], $
      C_Colors=Indgen(12)+1,  /Outline
   cgColorbar, Range=[Min(data), Max(data)], Divisions=12, NColors=12, Bottom=1, $
      Position=[0.125, 0.87, 0.9, 0.94], XTicklen=1, XMINOR=0
   cgPS_Close, /PNG, Resize=12.5
Other Coyote Graphics routines are being added all the time. Check the on-line documenation for the latest updates and routines.
![]()
Version of IDL used to prepare this article: IDL 7.0.1.
![]()
![]()


