
Creating a Histogram Plot
QUESTION: I tried drawing a histogram plot by setting the PSYM=10 keyword on the PLOT command. But, uh, it doesn't look like the histogram plot I was expecting. Did I do something wrong? I tried this.
   data = RandomU(5L, 200)*20
   Plot, Histogram(data, BINSIZE=1.0), PSYM=10
And I got this result. I don't know. The ends are funny, and the data seems to be about half a bin out of align with the axis annotation. I notice you have much better looking histogram plots in the Coyote Plot Gallery. Can you help me with this?
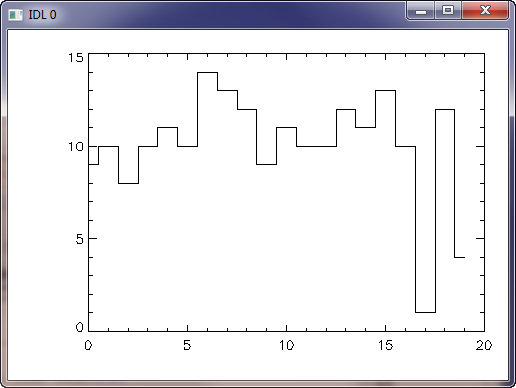 |
| This a normal histogram plot in IDL. |
![]()
ANSWER: Yes, I can help. The histogram plots in the Coyote Plot Gallery were written with the cgHistoplot program from the Coyote Library.
With this short program and the same data you are using, you can make a histogram plot with this IDL code.
cgHistoplot, data, BINSIZE=1.0
These commands will produce a plot like this.
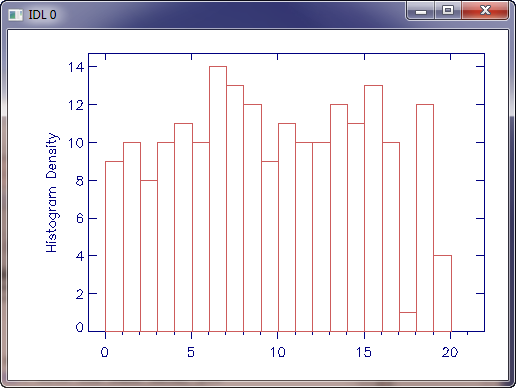 |
| This is what can be done with the cgHistoplot command from the Coyote Library. |
I usually prefer to fill the histogram bars, like this.
cgHistoplot, data, BINSIZE=1.0, /FILL
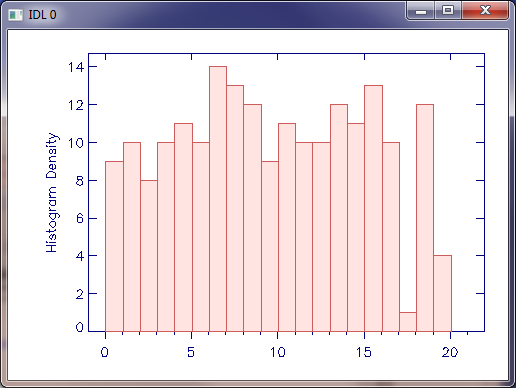 |
| The bars of the histogram plot are filled. |
The cgHistoplot command has many, many options. You can use different colors, different fill patterns, etc. Here is an example of some of the things that can be done.
   data = RandomU(5L, 200)*20
   !P.Multi = [0, 2, 2]
   cgHistoplot, data, BINSIZE=1.0
   cgHistoplot, data, BINSIZE=1.0, /FILL, POLYCOLOR=['charcoal', 'dodger blue']
   cgHistoplot, data, BINSIZE=1.0, /LINE_FILL, $
       POLYCOLOR=['charcoal', 'dodger blue'], ORIENTATION=[45, -45]
   cgHistoplot, data, BINSIZE=1.0, /FILL, POLYCOLOR='sky blue', MININPUT=0.0
   moredata = RandomU(3L, 80)*20
   cgHistoplot, moredata, BINSIZE=1.0, /FILL, POLYCOLOR='royal blue', MININPUT=0.0, /OPLOT
   !P.MULTI = 0
The figure below is produced when you execute the commands above.
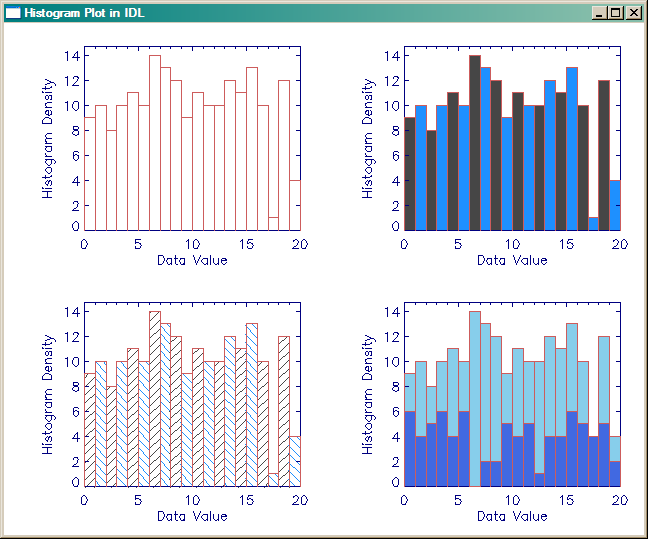 |
| The cgHistoplot command has many features. |
If you would like to see the histogram plot in a resizeable graphics window, with the option to send the output to a PostScript file or to create a high-quality raster image file, simply set the Window keyword.
   data = cgDemoData(7)
   cgHistoplot, data, BinSize=1.0, /Fill, Max_Value=5000, /Window
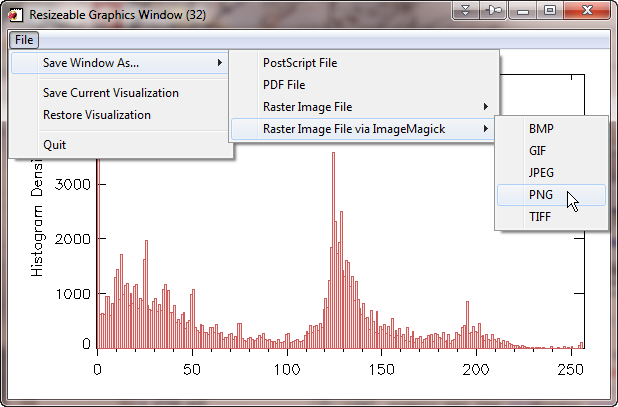 |
| The cgHistoplot can be displayed in a resizeable graphics window. |
As of 11 December 2011 in a Coyote Graphics update, it is now possible to send the graphics output of the cgHistoplot command (or any other basic Coyote Graphics command) directly to PostScript, PDF, BMP, GIF, JPEG, PNG, or TIFF files. Simply use the Output keyword to select the name of the file you wish to create. Here are some examples.
   cgHistoplot, data, BinSize=1.0, /Fill, Max_Value=5000, Output='test.ps'
   cgHistoplot, data, BinSize=1.0, /Fill, Max_Value=5000, Output='test.png'
   cgHistoplot, data, BinSize=1.0, /Fill, Max_Value=5000, Output='test.jpg'
Freely available and easily installed (if not already on your machine) software is required for this functionality. See the documentation for cgPS2PDF and cgPS2Raster for details.
![]()
Version of IDL used to prepare this article: IDL 7.0.1.
![]()
![]()
Last Updated: 12 December 2011


