
Resizeable Graphics Windows
QUESTION: Dude! It's the 21 century. How come I can't display a line plot in a resizeable graphics window in IDL!?
![]()
ANSWER: Well, you can. You just need to use the cgWindow command from the Coyote Library. This program can display any IDL traditional graphics command (e.g., Plot, Contour, Surface, etc.) in a resizeable graphics window. The program requires the name of the graphics command be passed into the program as a string. In addition, you can pass up to three positional parameters and any number of keyword parameters to the program. On-line documentation for cgWindow is available, and you can see well over 50 different plots that can be displayed in resizeable graphics windows in the Coyote Plot Gallery.
For example, to create a line plot in a resizeable graphics window, you could type this.
   IDL> data = cgDemoData(1)
   IDL> cgWindow, 'Plot', data, Background=cgColor('white'), Color=cgColor('black'), $
           PSYM=-4, XTitle='Time', YTitle='Signal', Charsize=cgDefCharsize()
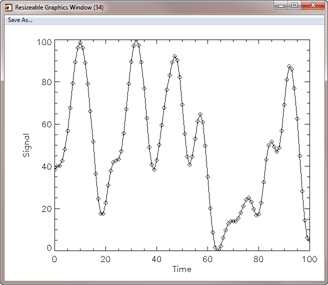 |
| Any IDL traditional graphics command can be displayed in a resizeable graphics window. |
The Save As... button in the upper-left of the graphics window will allow you to save this command in any of five different raster image file formats, including PNG and JPEG, or you can send the graphics command directly to a PostScript file.
You can easily pass and display your own graphics routines in cgWindow. All that is required is that your graphics routine be a procedure, defined with no more than three positional parameters (none are required), and an unlimited number of keywords. You must define an _EXTRA keyword for your graphics routine. You cannot open graphics windows or have any "window-related" commands in your program.
Here is a simple, user-written routine, named SimplePlot that can be displayed in cgWindow.
   PRO SimplePlot, data, PSYM=psym, SYMCOLOR=symcolor, _EXTRA=extra
       IF N_Elements(data) EQ 0 THEN data = Findgen(11)
       IF N_Elements(psym) EQ 0 THEN psym = 4
       IF N_Elements(symcolor) EQ 0 THEN symcolor = 'dodger blue'
       Plot, data
       OPlot, data, PSYM=psym, COLOR=cgColor(symcolor), SYMSIZE=1.5
   END
If you save and compile this routine, here is how you can display the routine in cgWindow.
   IDL> cgWindow, 'SimplePlot', cgDemoData(17), PSYM=2, SYMCOLOR='yellow', $
         WXSize=500, WYSize=375
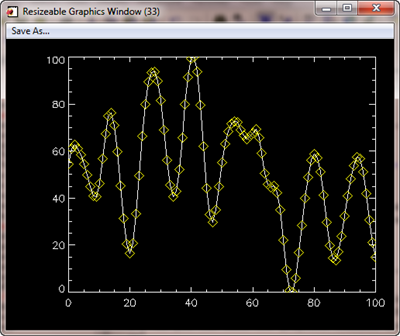 |
| User-written programs can be displayed in cgWindow. |
If you use Coyote Graphics programs with cgWindow you will not have to worry about your programs being written correctly to be displayed in a PostScript file. They will automatically be so. In fact, the Coyote Graphics routines cgPlot, cgContour, and cgSurf can all be displayed in cgWindow simply by setting the Window keyword on the command.
   IDL> data = cgDemoData(2)
   IDL> LoadCT, 33, NCOLORS=12, BOTTOM=1
   IDL> cgContour, data, NLEVELS=12, C_COLORS=Indgen(12)+1, /FILL, /WINDOW
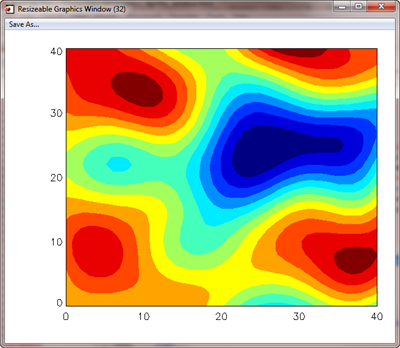 |
| A basic filled contour plot displayed in cgWindow. |
![]()
Adding, Replacing, Deleting, and Listing Commands with cgWindow
While this works, filled contour plots look better is they have contour lines drawn on top of them. This is easily possible just by adding another command to the cgWindow program. We will indicate we are adding a command to cgWindow by setting the AddCmd keyword.
IDL> cgWindow, 'cgContour', data, NLEVELS=12, COLOR='charcoal', /OVERPLOT, /ADDCMD
 |
| A filled contour plot with overlay displayed in cgWindow. |
This looks better, but we forgot to save space in the plot for a color bar. Let's replace the first command with one that has a Position keyword on it. We will indicate we are replacing a command by setting the ReplaceCmd keyword, and we will indicate which command we want to replace with the CmdIndex keyword. If the CmdIndex keyword is not used, all of the commands in cgWindow are replaced by the new command. In this way, you can use the window over and over again for different IDL commands. Or, you can simply create as many cgWindow windows as you like. Each is completely independent of the others, with its own list of commands that can be manipulated as we are here.
   IDL> cgWindow, 'cgContour', data, NLEVELS=12, C_COLORS=Indgen(12)+1, /FILL, $
            POSITION=[0.1, 0.1, 0.9, 0.75], /REPLACECMD, CMDINDEX=0
Now we can add a color bar.
   IDL> cgWindow, 'cgColorbar', NCOLORS=12, BOTTOM=1, RANGE=[Min(data),Max(data)], $
          DIVISIONS=12, XMINOR=0, XTICKLEN=1.0, /ADDCMD
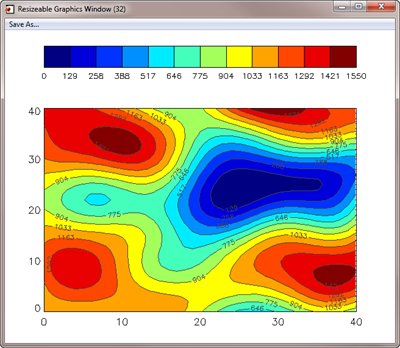 |
| A filled contour plot with color bar displayed in cgWindow. |
To change colors in an cgWindow display, use cgLoadCT or XColors with the Window keyword set. The WinID keyword can select which cgWindow, based on window index number, to apply the colors to. Otherwise, the current cgWindow colors are changed. The colors are changed immediately, and the commands re-executed whenever the colors change.
   IDL> cgLoadCT, 4, /Window, /Brewer, /Reverse
   IDL> XColors, /Window
If you want to see the commands that are currently in cgWindow, use the ListCmd keyword.
   IDL> cgWindow, /LISTCMD
        0. cgContour, p1, C_COLORS=value, FILL=value, NLEVELS=value, POSITION=value
        1. cgContour, p1, COLOR=value, NLEVELS=value, OVERPLOT=value
        2. cgColorbar, BOTTOM=value, DIVISIONS=value, NCOLORS=value, RANGE=value, XMINOR=value, XTICKLEN=value
The commands are listed in a generic fashion next to their command index numbers, as an aid to replacing or deleting a command. For example, if you wanted to delete the color bar command, you can use the DeleteCmd keyword to do this.
IDL> cgWindow, /DELETECMD, 2
![]()
Querying/Selecting/Deleting cgWindow Applications
Suppose you have created three cgWindow applications, like this.
   IDL> cgWindow, WTitle='Window 1'
   IDL> cgWindow, WTitle='Window 2'
   IDL> cgWindow, WTitle='Window 3'
If you wanted to obtain information about these three windows, we can use the cgQuery program to obtain their window index numbers, the widget identifiers of their top-level bases, their window titles, and/or their window object references. In this case, I'll get their window index numbers and window titles, and I'll return the number of windows on the display in the Count keyword..
   IDL> wids = cgQuery(TITLE=windowTitles, COUNT=count)
   IDL> FOR j=0,count-1 DO print, wids[j], '  ', windowTitles[j]
         32  Window 1
         33  Window 2
         34  Window 3
If I want just the information about the current cgWindow, I can set the Current keyword, like this:
   IDL> wid = cgQuery(TITLE=windowTitle, /CURRENT)
   IDL> Print, wid, '   ', windowTitle
         34  Window 3
If I want to make window 32 the current cgWindow, I can do it with the cgSet command in several ways. I can use the window index number, the window title, the identifier of the top-level base widget, or the window's object reference to select the application. I only need to set the appropriate keyword. Either of these two commands will make cgWindow 32 the current cgWindow. (Note that the window index number normally appears in the title bar of the window, unless you assign a different title to the window.) The windows pop forward on the display when they are selected. Note that setting cgSet by itself with no argument is equivalent to typing the WShow command. It will pop the current cgWindow forward on the display.
   IDL> cgSet, 32
   IDL> cgSet, 'Window 1', /TITLE
Now I can add graphics commands to window 32.
IDL> cgPlot, cgDemoData(17), /AddCmd
Next, I make window 2 the current cgWindow and put a filled contour plot in this window.
   IDL> cgSet, 'Window 2', /TITLE
   IDL> cgContour, data, /Fill, Position=[0.1,0.1,0.9,0.75], /AddCmd
   IDL> cgContour, cgDemoData(2), /Overplot, COLOR='gray', /AddCmd
   IDL> cgColorbar, RANGE=[Min(data), Max(data)], /AddCmd
If I wish to delete the cgWindow with the title "Window 3" I can likewise make the selection in any of four different ways with the cgDelete command. Either of these two commands will delete the window.
  IDL> cgDelete, 32
  IDL> cgDelete, 'Window 3', /TITLE
If you wish to delete all the cgWindow programs on the display, set the All keyword.
IDL> cgDelete, /All
![]()
Multiple Plots with cgWindow Applications
It is possible to create multiple plot windows with cgWindow. Use the WMulti keyword in a fashion identical to using !P.MULTI to set the layout for cgWindow. Here is an example in which two plots are displayed side by side.
    IDL> data = cgDemoData(17)
    IDL> cgWindow, 'cgPlot', data, COLOR='red', WMULTI=[0,2,1]
    IDL> cgWindow, 'cgPlot', data, PSYM=2, /OVERPLOT, COLOR='dodger blue', /AddCmd
    IDL> cgWindow, 'cgPlot', cgDemoData(17), COLOR='olive', LINESTYLE=2,  /AddCmd
    IDL> cgDelete
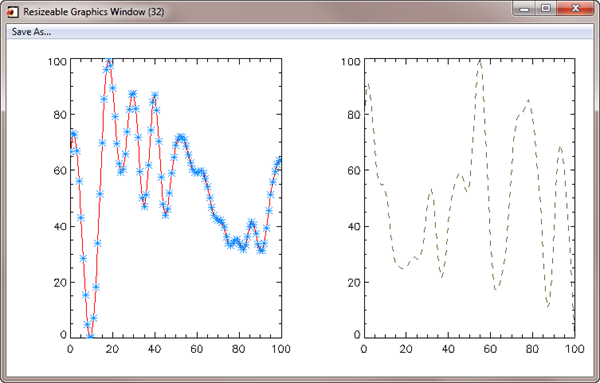 |
| Multiple plots are possible with cgWindow. |
![]()
Hardcopy Output with cgWindows
Using the Save As... button in the upper left corner of the window, you can send the commands directly to a PostScript file, or you can create raster file output in five different formats. If the ImageMagick convert command can be found on your computer, you will also find in this pull-down menu the means to create raster files by converting PostScript files to raster output with ImageMagick. This option results in much higher quality raster files, mostly because PostScript or true-type fonts are used in the plot, rather than Hershey fonts. If ImageMagick cannot be found on your computer, this option will not appear.
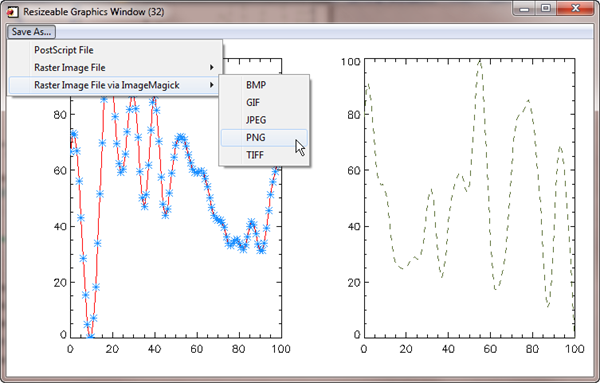 |
| Raster and PostScript output can be obtained directly from within cgWindow. |
Here are PNG files created using the normal raster method (top) and by converting the PostScript output to a PNG file with ImageMagick.
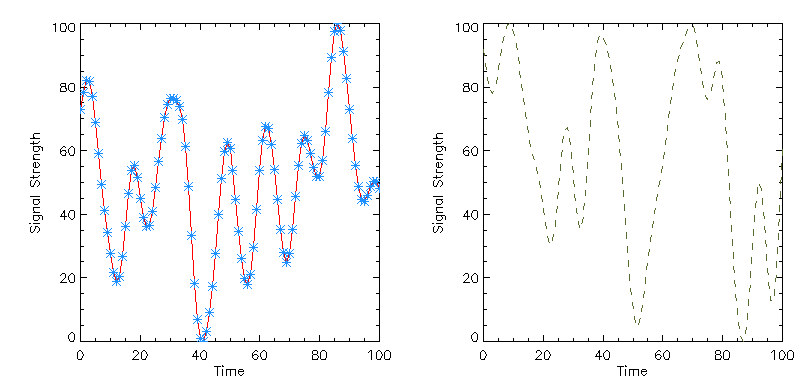 |
| Normal PNG file output from cgWindow. |
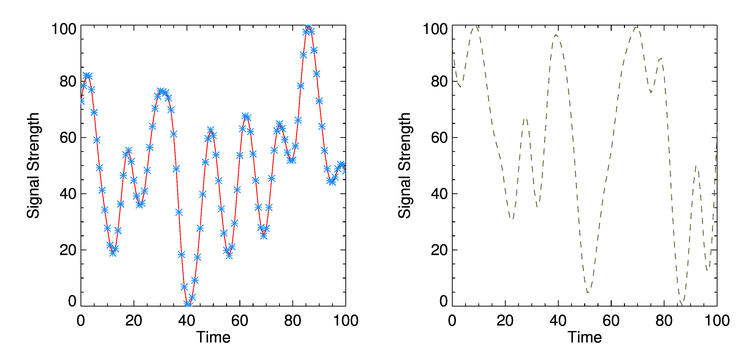 |
| ImageMagick PNG file output from cgWindow. |
![]()
Coyote Graphics Routines and cgWindow
The Coyote Graphics routines have been updated to take advantage of cgWindow functionality. If fact, you can use these resizeable graphics windows exactly as you are accustomed to using normal IDL graphics windows. All you need do is set the Window keyword on any Coyote Graphics routine to have it use the current cgWindow as its graphics window. Here is an example of how it works. First, create an cgWindow.
IDL> cgWindow
Next, display a line plot in the cgWindow you just created.
IDL> cgPlot, cgDemoData(1), /AddCmd
You can resize the window, send the contents to a PostScript file, etc. Now, display a contour plot in the same window.
   IDL> LoadCT, 33
   IDL> data = cgDemoData(2)
   IDL> cgContour, data, /Fill, Position=[0.1,0.1,0.9,0.75], /Window
   IDL> cgContour, cgDemoData(2), /Overplot, COLOR='gray', /AddCmd
   IDL> cgColorbar, RANGE=[Min(data), Max(data)], /AddCmd
Finally, display a surface plot in the same window.
IDL> cgSurf, data, /Shaded, /Elevation, /Window
Now create a new window and put the original plot command in this new window.
   IDL> cgWindow
   IDL> cgPlot, cgDemoData(1), /Window
![]()
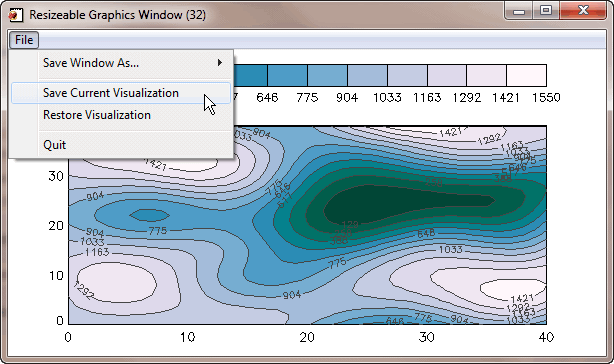
Save and Restore Visualizations
The current commands in a cgWindow (the visualization) can be saved to a file, e-mailed to a colleague so he or she can be looking at the same visualization you are, and restored whenever you like. Simply use the Save and Restore Visualization buttons under the File menu on the interface.
 |
| The visualization can be saved and restored at any time. |
![]()
Version of IDL used to prepare this article: IDL 7.0.1.
![]()
![]()


