.\
cghistoplot.pro
top cgHistoplot
Graphics
cgHistoplot, data [, /ADDCMD] [, AXISCOLORNAME=string] [, BACKCOLORNAME=string] [, BINSIZE=BINSIZE] [, CHARSIZE=float] [, COLOR=string] [, DATACOLORNAME=string] [, FILENAME=string] [, /FILLPOLYGON] [, /FREQUENCY] [, HISTDATA=HISTDATA] [, /L64] [, LAYOUT=integer] [, /LINE_FILL] [, LINE_THICK=integer] [, LOCATIONS=LOCATIONS] [, /LOG] [, MAXINPUT=MAXINPUT] [, MAX_VALUE=MAX_VALUE] [, MIN_VALUE=MIN_VALUE] [, MININPUT=MININPUT] [, MISSING=MISSING] [, /NAN] [, NBINS=integer], NOERASE=NOERASE [, OL_STYLE=integer] [, OMAX=OMAX] [, OMIN=OMIN] [, /OPLOT] [, /OPROBABILITY] [, ORIENTATION=float] [, OUTFILENAME=string] [, /OUTLINE] [, OUTPUT=string] [, PATTERN=PATTERN] [, PEAK_HEIGHT=PEAK_HEIGHT] [, POLYCOLOR=string] [, POSITION=fltarr] [, PROBABILITY_FUNCTION=float] [, PROBCOLORNAME=string] [, PROBTHICK=float] [, REVERSE_INDICES=REVERSE_INDICES] [, /ROTATE] [, SMOOTH=integer] [, SPACING=SPACING] [, THICK=integer] [, TITLE=string] [, /WINDOW] [, XTICKNAMES=string] [, XTICKFORMAT=string] [, XTICKS=integer] [, XTICKVALUES=XTICKVALUES] [, XTITLE=string] [, YTICKNAMES=string] [, YTICKFORMAT=string] [, YTICKS=integer] [, YTICKVALUES=YTICKVALUES] [, YTITLE=string] [, _REF_EXTRA=_REF_EXTRA]
This program is used to draw a histogram plot in an IDL direct graphics window..
The program requires the Coyote Library to be installed on your machine.
Parameters
- data in required
The data from which the histogram is created.
Keywords
- ADDCMD in optional type=boolean default=0
Set this keyword to add the command to the resizeable graphics window cgWindow.
- AXISCOLORNAME in optional type=string default=opposite
The name of the axis color. All color names are derived from cgColor.
- BACKCOLORNAME in optional type=string default=background
The name of the background color. All color names are derived from cgColor.
- BINSIZE in optional
The binsize of the histogram. By default, Scott's Choice of bin size for histograms is used:
If BINSIZE in not defined, and NBINS is defined, the BINSIZE is calcuated as:binsize = (3.5 * StdDev(data)) / N_Elements(data)^(0.3333)While it is pointed out in the HISTOGRAM documentation, it is extremely important that the BINSIZE be of the same data type as the data you are going to calculate the histogram of. If it is not VERY strange things can happen. I've tried to protect you from most of the bad things, but I don't have a high confidence level that I have done it for every situation. If you see something that "just don't look right", I would check first to see if your data types match. That might solve all your problems.binsize = (Max(dataToHistogram) - Min(dataToHistogram)) / (NBINS -1)- CHARSIZE in optional type=float
The character size of the annotations. Default set by calling cgDefCharSize().
- COLOR in optional type=string
Used as a shorthand way of setting the
DataColorNamekeyword or, if theFillPolygonkeyword is set, thePolyColorkeyword. Only used if those other two keywords are not set.- DATACOLORNAME in optional type=string default=indian red
The name of the data color for drawing the histogram outlines.
- FILENAME in optional type=string
The name of a color name file to use with cgCOLOR.
- FILLPOLYGON in optional type=boolean default=0
Set this keyword to fill the histogram polygons with the
POLYCOLOR.- FREQUENCY in optional type=boolean default=0
If this keyword is set, the relative frequency is plotted on the Y axis, rather than the histogram density.
- HISTDATA out optional
The output value of the internal HISTOGRAM command.
- L64 in optional type=boolean default=0
If set, the return value of HISTOGRAM are 64-bit integers, rather than the default 32-bit integers.
- LAYOUT in optional type=integer
This keyword specifies a grid with a graphics window and determines where the graphic should appear. The syntax of LAYOUT is a 3-element array: [ncolumns, nrows, location]. The grid is determined by the number of columns (ncolumns) by the number of rows (nrows). The location of the graphic is determined by the third number. The grid numbering starts in the upper left (1) and goes sequentually by column and then by row.
- LINE_FILL in optional type=boolean default=0
If set, the polygons are filled with lines instead of solid color. If this keyword is set, the following keywords can also be used:
ORIENTATION,PATTERN,POLYCOLOR, andSPACING.- LINE_THICK in optional type=integer default=1
Set this keyword to set the thickness of lines used in the fill pattern. Applies only if the
Line_Fillkeyword is set.- LOCATIONS out optional
Starting locations of each bin. (See the HISTOGRAM documentation for details.)
- LOG in optional type=boolean default=0
Set this keyword if you wish the histogram count to be represented on a logarithmic scale.
- MAXINPUT in optional
The maximum value to use in calculating input histogram. Equivalent to the MAX keyword in the HISTOGRAM documentation.
- MAX_VALUE in optional
The maximum Y data value to represent on graphics plot. Default: Max(data) * 1.05.
- MIN_VALUE in optional
The minimum Y data value to represent on graphics plot. Default: 0.
- MININPUT in optional
The minimum value to use in calculating input histogram. Equivalent to the MIN keyword in the HISTOGRAM documentation.
- MISSING in optional
The value that should be represented as "missing" and not used in the histogram. Be aware that if the input data is not of type "float" or "double" that the input data will be converted to floating point prior to calculating the histogram.
- NAN in optional type=boolean default=0
If set, ignore NAN values in calculating and plotting histogram.
- NBINS in optional type=integer
The number of output bins in the histogram. Meaning is slightly different from meaning in the HISTOGRAM command. Used only to calculate BINSIZE when BINSIZE is not specified. In this case, binsize = rangeofData/(nbins-1).
- NOERASE
- OL_STYLE in optional type=integer default=0
Set to the index of the line style to use in drawing the histogram boxes.
- OMAX out optional
The maximum output value used to construct the histogram. (See HISTOGRAM documentation.)
- OMIN out optional
The minimum output value used to construct the histogram. (See HISTOGRAM documentation.)
- OPLOT in optional type=boolean default=0
Set this keyword if you want to overplot the histogram on already established axes.
- OPROBABILITY in optional type=boolean default=0
Set this keyword if you want to overplot the cumulative probability on the plot.
- ORIENTATION in optional type=float default=0.0
The orientation (rotations) of the lines used to fill the polygons if
LINE_FILLis set. (See POLYFILL documentation.)- OUTFILENAME in optional type=string
If the
Outputkeyword is set, the user will be asked to supply an output filename, unless this keyword is set to a non-null string. In that case, the value of this keyword will be used as the filename and there will be no dialog presented to the user.- OUTLINE in optional type=boolean default=0
Set this keyword if you wish to draw only the outline of the histogram plot, in a manner similar to setting PSYM=10 on a PLOT command.
- OUTPUT in optional type=string
Set this keyword to the type of output desired. Possible values are these:
Or, you can simply set this keyword to the name of the output file, and the type of file desired will be determined by the file extension. If you use this option, the user will not be prompted to supply the name of the output file.'PS' - PostScript file 'EPS' - Encapsulated PostScript file 'PDF' - PDF file 'BMP' - BMP raster file 'GIF' - GIF raster file 'JPEG' - JPEG raster file 'PNG' - PNG raster file 'TIFF' - TIFF raster fileAll raster file output is created through PostScript intermediate files (the PostScript files will be deleted), so ImageMagick and Ghostview MUST be installed to produce anything other than PostScript output. (See cgPS2PDF and cgPS_Close for details.) And also note that you should NOT use this keyword when doing multiple plots. The keyword is to be used as a convenient way to get PostScript or raster output for a single graphics command. Output parameters can be set with cgWindow_SetDefs.
- PATTERN in optional
The fill pattern for the polygons if the
FILLPOLYGONkeyword is set. (See POLYFILL documentation.)- PEAK_HEIGHT in optional
Set this keyword to the height of the highest peak in the histogram. All other peaks will be rendered proportional to this value. Setting this keyword also sets the
Frequencykeyword to 0.- POLYCOLOR in optional type=string default=rose
The name of the polygon fill color if the
FILLPOLYGONkeyword is set.- POSITION in optional type=fltarr
The position of the plot axes in normalized data coordinates, [x0,y0,x1,y1].
- PROBABILITY_FUNCTION out optional type=float
The total cummulative probability of the histogram plot, scaled from 0 to 1.
- PROBCOLORNAME in optional type=string default=blue
The name of the probability color for overplotting the cumulative probability on the plot.
- PROBTHICK in optional type=float default=1.0
The thickness of the probability line drawn on the plot.
- REVERSE_INDICES out optional
The list of reverse indices returned from the HISTOGRAM command. (See HISTOGRAM documentation.)
- ROTATE in optional type=boolean default=0
Set this keyword to cause the histogram bins to be drawn from left to right, rather than from bottom to top.
- SMOOTH in optional type=integer default=0
Set this keyword to an odd positive integer to smooth the histogram output before plotting. The integer will set the width of a smoothing box to be applied to the histogram data with the Smooth function.
- SPACING in optional
The spacing of fill line if the 'LINE_FILL
keyword is set. (See POLYFILL documentation.)- THICK in optional type=integer default=1
Set this keyword to a value greater than 1 to draw thicker axes and lines.
- TITLE in optional type=string
Set this keyword to the plot title.
- WINDOW in optional type=boolean default=0
Set this keyword to replace all the commands in the current cgWindow or to create a new cgWindow, if one doesn't currenly exist, for displaying this command. To create a new cgWindow if one currenly exists, use the
cgWindowcommand.- XTICKNAMES in optional type=string
An array of tick names for the axis.
- XTICKFORMAT in optional type=string
As tick format or name of tick formatting function for the axis.
- XTICKS in optional type=integer
The number of major tick spaces for the axis.
- XTICKVALUES in optional
A vector of tick values that should be labelled on the axis.
- XTITLE in optional type=string default=Relative Frequency
The X title of the histogram plot.
- YTICKNAMES in optional type=string
An array of tick names for the axis.
- YTICKFORMAT in optional type=string
As tick format or name of tick formatting function for the axis.
- YTICKS in optional type=integer
The number of major tick spaces for the axis.
- YTICKVALUES in optional
A vector of tick values that should be labelled on the axis.
- YTITLE in optional type=string default=Histogram Density
The Y title of the histogram plot.
- _REF_EXTRA in optional
Any additional PLOT keywords are passed via keyword inheritance.
Examples
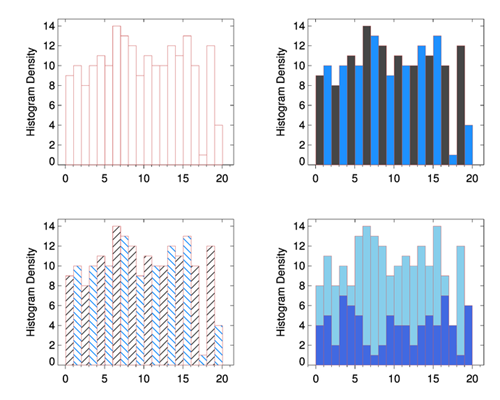
Some of the ways cgHistogram can be used:
  cgHistoplot, Dist(256), BINSIZE=5.0
  cgHistoplot, Fix(RandomU(seed, 200)*20), POLYCOLOR=['charcoal', 'steel blue'], /FILLPOLYGON
  cgHistoplot, Fix(RandomU(seed, 200)*20), POLYCOLOR=['navy', 'forest green'], /LINE_FILL, ORIENTATION=[45,-45]
http://www.idlcoyote.com/gallery/index.html
Author information
- Author:
FANNING SOFTWARE CONSULTING:
David W. Fanning 1645 Sheely Drive Fort Collins, CO 80526 USA Phone: 970-221-0438 E-mail: david@idlcoyote.com Coyote's Guide to IDL Programming: http://www.idlcoyote.com- Copyright:
Copyright (c) 2007-2014, Fanning Software Consulting, Inc.
- History:
Change History:
  Written by:  David W. Fanning, 14 November 2007.
  Modified to work with !P.MULTI. 20 Nov 2007. DWF.
  Slight problem with extra space at the right end of the plot resolved. 20 Nov 2007. DWF.
  Added FILE and NOLINES keywords. 24 Nov 2007. DWF.
  Added additional HISTOGRAM access via keywords. 24 Nov 2007. DWF.
  Fixed a small problem with FILLPOLY keyword. 26 Nov 2007. DWF.
  Fixed a small problem with the OVERPLOTTED histogram being slightly offset. 12 Jan 2009. DWF
  Major reconstructive surgery on the actual drawing part of the program. As far as I can
     tell, all functionality is the same, but without drawing problems evidenced before. 14 March 2009. DWF.
  A small problem with the way I was specifying ranges caused the bars to be slightly offset. 23 March 2009. DWF.
  I fixed a small problem with BINSIZE and HISTOGRAM data type matching (see the Note), and I also
     fixed a small problem with the range calculations when byte data is passed in. 1 April 2009. DWF.
  I removed a NOLINES keyword, which was no longer being used. 1 April 2009. DWF.
  MIN_VALUE and MAX_VALUE keywords now work again, thanks to Josiah Schwab. 22 April 2009. DWF.
  Changed default POLYFILL color to "ROSE". 22 April 2009. DWF.
  Having problems with binsize selection when data to histogram is an integer type. Fixed. 8 June 2009. DWF.
  When the input array has a considerable number of NANs, the Histogram command complains with an error
      "Array has too many elements." This happens even when the NAN keyword is set for the Histogram
      command. So, I now screen for NANs before I process the histogram. 8 June 2009. DWF.
  Added MISSING keyword to represent missing data. 18 July 2009. DWF.
  Adding the MISSING keyword exposed a problem I had in restoring the original input data
      to its original values when there were NANs and MISSING values. Fixed now by making
      a copy of the data to work on internally. Everything else is too complex. 20 July 2009. DWF.
  Yikes! Bad error in calculating start and end of histogram plot when overplotting fixed. 4 Sept 2009. DWF.
  Added needed XSTYLE=1 to AXIS command to match Plot axis labelling. 19 Oct 2009. DWF.
  Added a THICK keyword. 9 November 2009. DWF.
  Added an OUTLINE keyword so only the outline of the histogram is plotted. 3 December 2009. DWF.
  I was trying to be a good citizen by reloading the input color table when I exited
       the program. But, of course, that makes it impossible to use the program in
       the Z-buffer. Fixed by being less of a good citizen. 23 July 2010. DWF.
  Because of the way I was dealing with NANs and MISSING data, the reverse indices were
       inaccurate when they were returned, if there was NANs or MISSING data in the
       input array. The data is now being handled correctly in all cases. This requires
       that missing data must be set to !VALUES.F_NAN prior to calculating the histogram.
       This means the data MUST be converted to floats for this operation. Since I am
       always working on a *copy* of the data when this occurs, it should not affect
       user input data. Also, I scan all input floating point and double data for NANs,
       and if found, and the NAN keyword is not set, I issue a warning and set the NAN
       keyword. This is a change in behavior. 1 October 2010. DWF.
  Fixed a problem when specifying more than one POLYCOLOR. I made a change to the program
       and forgot to propogate it everywhere. 4 October 2010. DWF.
  Default axis color name changed from "Navy" to "Black". 28 October 2010. DWF.
  Fixed a problem with restoring color tables in PostScript. 24 Nov 2010. DWF.
  Added OPROBABILITY, PROBCOLOR, and PROBABILITY keywords. 24 Nov 2010. DWF.
  Changed the way I find a default axis color. 3 Dec 2010. DWF.
  Expanded search for "integers" from in BINSIZE calculation from DataType LE 3
        to include DataType GE 12, too. 8 Dec 2010. DWF.
  Added WINDOW keyword. 24 Jan 2011. DWF.
  Added ADDCMD keyword. 26 Jan 2011. DWF.
  Added LAYOUT keyword. 28 Jan 2011. DWF.
  Added CHARSIZE keyword. 2 Feb 2011. DWF.
  Added YTITLE keyword. 9 May 2011. DWF.
  Worked around a PLOT problem when setting the X axis range that caused the Y axis
     range to be corrupted. 19 May 2011. DWF.
  Added the ROTATE keyword. 18 Aug 2011. DWF.
  I was calculating and displaying the cumulative probability distribution function
      incorrectly. Now changed to what I think is the correct result. 8 Nov 2011. DWF.
  Added the ability to send the output directly to a file via the OUTPUT keyword. 9 Dec 2011, DWF.
  PostScript, PDF, and Imagemagick parameters can now be tailored with cgWindow_SetDefs. 14 Dec 2001. DWF.
  I had a problem with OVERPLOTs being slightly offset because I was calculating the xrange
      and yrange, rather than taking them from !X.CRange and !Y.CRange. 17 Dec 2011. DWF.
  Modified to use cgDefaultColor for default color selection. 24 Dec 2011. DWF.
  Incomplete implementation of new color selection scheme, fixed. 30 Dec 2011. DWF.
  The change of 17 Dec 2011 was incorrect, as I misunderstood the problem. Restored original. 30 Dec 2011. DWF.
  Changes to allow better default colors, based on changes to cgColor and cgDefaultColor. 1 Feb 2012. DWF.
  Added a SMOOTH keyword. 26 April 2012. DWF.
  Small fix (CR missing!) to allow overplotting in cgWindow. 26 April 2012. DWF.
  The Outline keyword was incorrectly drawing the last histogram bin outline. Fixed. 26 April 2012. DWF.
  Added POSITION and PROBTHICK keywords to set the plot position and the thickness of the cumulative
     probability line, respectively. 25 May 2012. DWF.
  If the cumulative probability option (keyword OPROBABILITY) is set, a second axis is drawn indicating
     the cumulative probablity from 0 to 1. 25 May 2012. DWF.
  Whoops! Don't want to set default position unless Total(!P.MULTI) equals zero. 25 May 2012. DWF.
  More work on getting the cumulative probability to be correctly plotted. 30 May 2012. DWF.
  More whoops! Setting POSITION now interfering with LAYOUT keyword. More fixes to restore LAYOUT. 26 July 2012. DWF.
  Aaauuughhh! Typo introduced in yesterday's fix before I saved final version. 27 July 2012. DWF.
  Added the ability to use escape characters in plot titles to specify cgSymbol symbols. 27 July 2012. DWF.
  Mis-spelled "probability" in one section of the code. Fixed. 31 July 2012. DWF.
  Added COLOR keyword. 19 Sept 2012. DWF.
  Now restoring previous plot parameters after drawing cumulative probability axis, so as not
      to interfere with subsequent overplotting. 27 Sept 2012. DWF.
  Changed the way the "ystart" variable is set on log plots. 21 Jan 2013. DWF.
  Now taking into account the MININPUT and MAXINPUT values when calculating a default bin size. 19 Feb 2013. DWF.
  Added [XY]TickNames, [XY]Tickformat, [XY]TickS, and [XY]TickValues keywords. 21 Feb 2013. DWF.
  Now choosing the default tick format of '(F)' when LOG is set. 28 April 2013. DWF.
  Added Line_Thick keyword to change thickness of fill line. 28 Aug 2013. DWF.
  Changed the default background color to "white" from "background" and default axis
      color to "black" from "opposite". It's about time this routine behaved like other
      Coyote Graphic routines! 22 Oct 2013. DWF.
  Fixed problem with XTICKVALUES and YTICKVALUES keywords when plot is rotated. 19 Nov 2013. DWF.
  Added OL_STYLE keyword. 25 Feb 2014. DWF.
  Added Peak_Height keyword. 26 May 2014.
File attributes
| Modification date: | Fri Mar 27 11:07:36 2015 |
| Lines: | 1,305 |
| Docformat: | rst rst |