
Coyote Graphics Programs
These are programs from the Coyote Library that are specifically identified as being associated with the Coyote Graphics System. Documentation for Coyote Graphics routines is now available on-line. These programs are included in the Coyote Library. Please consult this article if you are having any difficulty running a Coyote Graphics program. If you are looking for ideas for your own graphics output, visit the Coyote Plot Gallery for examples and IDL code for over 50 different plots you can create with Coyote Graphics routines.
Major Graphics Commands
- cgCOLOR The heart and soul of the Coyote Graphics system!
- cgCOLORBAR Creates direct graphics color bar.
- cgCONTOUR A device-independent and color-independent wrapper for the CONTOUR command.
- cgHISTOPLOT Draws a histogram plot (direct graphics).
- cgIMAGE Device independent replacement for TV. Works with !P.Multi and Position keyword.
- cgLEGEND Creates a legend in a graphics display window.
- cgPLOT A device-independent and color-independent wrapper for the PLOT command.
- cgPLOTS A device-independent and color-independent wrapper for the PLOTS command.
- cgSTRETCH Interactively increase image contrast with various image pixel transformations.
- cgSURF A device-independent and color-independent wrapper to the SURFACE and SHADE_SURF commands.
- cgSURFACE A full-rotating, object graphics surface command with texture mapping.
- cgTAYLORDIAGRAM Creates a Taylor Diagram plot from user data.
- cgZPLOT An interactive zoom/pan compound widget or application for line plots.
- cgZIMAGE An interactive zoom widget for 2D and true-color images.
Minor Graphics Commands
- cgARROW Draws an arrow in a graphics window.
- cgASPECT Creates a position in the display window with a particular aspect ratio.
- cgAXIS A device/color independent wrapper for the AXIS command.
- cgBARPLOT Draws data as a bar plot.
- cgBLENDIMAGE Allows the user to blend two images together.
- cgBOXPLOT Draws data as a box and whisker plot.
- cgDOTPLOT A fancy plot, used more often in business presentations.
- cgDRAWVECTORS Draws velocity vectors on a map or other IDL graphics display.
- cgLAYOUT Returns positions for positioning graphics in a column/row grid.
- cgPOLYGON A device-independent and color-independent program for creating filled or unfilled polygons.
- cgSCATTER2D Creates a scatter plot between two variables.
- cgSNAKE Applies active contouring Gradient Vector Flow "snake" contour algorithm to 2D dataset.
- cgSNAPSHOT Device independent replacement/upgrade for TVRD. Creates raster files directly.
- cgSYMBOL Draws device independent Greek (φ, ξ, λ, etc.) and other symbols (Å, ≠, ≡, etc.) in programs.
- cgSYMCAT A symbol catalog with 46 possible symbols to use in IDL graphics plots.
- cgTEXT A wrapper for XYOUTS that writes (and places) text in a color independent manner.
- cgWINDROSE Creates a wind rose diagram from wind speed and direction arrays.
Color Graphics Commands
- cgCOLOR The heart and soul of the Coyote Graphics system!
- cgCOLOR24 Converts RGB color value to 24-bit integer.
- cgCOLORBAR Creates direct graphics color bar.
- cgCOLORFILL A device-independent and color-independent wrapper for the POLYFILL command.
- cgDCBAR A discrete color bar with a handful of colors and centered labels.
- cgDEFAULTCOLOR This function defines a default color for Coyote Graphics routines.
- cgGETCOLORSTATE Returns a device/version independent current decomposition state.
- cgLOADCT A drop-in replacement for LOADCT with additional functionality.
- cgPICKCOLORNAME Utility for picking or specifying a color by name.
- cgSETCOLORSTATE Sets a device/version independent current decomposition state.
- cgTIMESTAMP A utility program to create a time stamp in 11 different formats.
- cgTRANSPARENTIMAGE Creates a semi-transparent image with optional missing color “knocked-out”.
Utility Commands
- cgADDTOPATH Allows the user to add a directory to the IDL !PATH system variable.
- cgAPPENDTOFILENAME Appends a string to the root name of a longer file name.
- cgCENTERTLB Centers a widget program on the display.
- cgCHECKFORSYMBOLS Parses a text string for embedded cgSymbol characters.
- cgCONLEVELS A function for creating contour levels for the cgContour command.
- cgCONTAINER A modified IDL_Container object with properties important for Coyote Graphics.
- cgCOORD A coordinate object for Coyote Graphics routines.
- cgDEFCHARSIZE A routine define the default character size for Coyote Graphics routines.
- cgDEMODATA Opens data files found in the IDL distribution.
- cgDBLTOSTR Converts a double precision value to a string in a way that preserves significant digits.
- cgERRORMSG Provides a tailored error message when used in Catch error handlers.
- cgFINDPATHTO Finds a path to a resource (data, bitmap, etc.) file.
- cgGRAPHICSKEYWORDS Maintains a list and the values of typical "graphics keywords".
- cgGREEK Returns a letter from the Greek alphabet as a string for plot annotation.
- cgHISTOGRAM A wrapper for HISTOGRAM that prevents silent errors and adds functionality.
- cgIMAGEINFO Works with cgIMAGE to display interactive image locations and values.
- cgJULIAN2DATE Converts a Julian Number into a well-formatted date string.
- cgKRIG2D Perform two-dimensional kriging orders of magnitude faster than Krig2D.
- cgNUMBER_FORMATTER A utility routine to format numbers used in text widgets.
- cgMONTHS Returns a month string in various formats for graphic rendering.
- cgNORMALIZE Creates scaling vector that positions graphic elements in graphic views.
- cgOBJ_ISA Similar to the built-in OBJ_ISA, but with more features.
- cgOTSU_THRESHOLD Finds the threshold between bimodal populations of pixels in an image.
- cgPERCENTILES Function to calculate percentiles in a data set.
- cgPICKFILE A wrapper for Dialog_Pickfile that remembers your last selection.
- cgPROGRESSBAR Implements a "show progress" bar.
- cgPSDIMS Find the dimensions of a PostScript file by reading the Bounding Box values.
- cgREVERSEINDICES A routine read the histogram reverse indices vector in a simple way.
- cgRESIZEIMAGE A Congrid command without Congrid's weaknesses for resizing images.
- cgRESIZERASTER Resize a raster file to new dimensions.
- cgROOTNAME Return the base or root of the filename, the directory name, and the file extension as strings.
- cgSCALEVECTOR Scales vector or array between given MIN and MAX values.
- cgSET_TTFONT Sets the True-Type font for PostScript and raster output.
- cgSETDIFFERENCE Finds the difference between two sets of integer values.
- cgcSETINTERSECTION Finds the intersection between two sets of integer values.
- cgSETUNION Finds the union between two sets of integer values.
- cgSOURCEDIR Identifies the directory of the file that calls this function.
- cgWHOAMI Identifies the program module containing this function.
- cgWHOCALLEDME Identifies the program module calling this function.
Window Commands
- cgCONTROL A routine for setting and controlling cgWINDOW properties.
- cgDELETE A routine to delete an cgWINDOW from the display.
- cgDISPLAY A device-independent and color-independent wrapper for the WINDOW command.
- cgERASE A wrapper for ERASE that erases window in white color.
- cgQUERY A utility routine to gather information about cgWINDOW applications on the display.
- cgSET A WSet command for cgWINDOW.
- cgSHOW A WShow command for cgWINDOW.
- cgWINDOW A "smart" graphics window. Resizeable with automatic file output.
- cgWINDOW_GETDEFS Gets default values for cgWINDOW.
- cgWINDOW_SETDEFS Sets default values for cgWINDOW.
Output Commands
- cgCBAR2KML Creates a color bar for KML files in Google Earth.
- cgFIXPS Fixes IDL PostScript landscape output files so they display with proper orientation.
- cgIMAGE2KML Creates a KML file to overlay an image in Google Earth.
- cgKML_FEATURE Implements an abstract KML Feature object class.
- cgKML_FILE Creates a KML file to be displayed in Google Earth.
- cgKML_GROUNDOVERLAY Implements an KML GroundOverlay element.
- cgKML_LOOKAT Implements an abstract KML LookAt object class.
- cgKML_OBJECT Implements an abstract KML Object object class.
- cgKML_OVERLAY Implements an abstract KML Overlay object class.
- cgKML_SCREENOVERLAY Implements a KML ScreenOverlay object class.
- cgKML2KMZ Create KMZ files from KML and image files.
- cgPS2PDF A device-independent way to create PDF files from PostScript intermediary files.
- cgPS2RASTER Create BMP, GIF, JPEG, PDF, PNG, and TIFF files from PostScript intermediary files.
- cgPS_OPEN Opens a PostScript file for input.
- cgPS_CLOSE Closes a PostScript file and optionally makes raster file.
Mapping Commands
- cgCBAR2KML Creates a color bar for KML files in Google Earth.
- cgCHANGEMAPPROJECTION Warps an image in one map projection to another.
- cgCLIPTOMAP Clip or subset a georegistered image to a map boundary.
- cgDRAWSHAPES A program to draw shapefile polygons on map projections.
- cgEXTRACTSHAPE Extracts a single shape or polygon from a shapefile.
- cgFINDMAPBOUNDARY Finds the the boundary of the map projected grid for files that allow it.
- cgGEOMAP Automatically georegisters a GeoTiff image.
- cgGOOGLE_METERSPERPIXEL Calculates meters per pixel value for Google Static Maps.
- cgGOOGLEMAPMARKER__DEFINE Defines a marker structure for Google Static Maps.
- cgGOOGLEMAPWIDGET A compound object-widget for adding Google Static Maps to an application.
- cgGOOGLEMAPWIDGET__DEFINE The cgGoogleMapWidget object.
- cgIMAGE2KML Creates a KML file to overlay an image in Google Earth.
- cgMAP_CONTINENTS A Coyote Graphics wrapper for Map_Continents.
- cgMAP_GRID A Coyote Graphics wrapper for Map_Grid that fixes a number of problems.
- cgMAP_GSHHS Draws outlines from the GSHHS shoreline data on maps.
- cgMAP_SET A Coyote Graphics wrapper for Map_Set.
- cgMAP A more powerful means of creating and using GCTP map projections.
- cgMAPCONTINENTS An object wrapper for cgMap_Continents and cgMap_GSHHS.
- cgMAPGRID An object wrapper for cgMap_Grid.
- cgMAPPLOTS Draws lines and symbols on map projections set up with cgMap.
- cgMAPVECTOR Draws vectors (arrows) on map projections set up with cgMap.
- cgNCDFMAP Creates a map coordinate object for netCDF files with map projections.
- cgSHAPEINFO Allows the user to browse shapefiles containing geographical information.
- cgTERMINATOR_MAP Creates a day/night map terminator on a map projection.
- cgUTMZONE Returns the UTM zone for a particular longitude and latitude.
- cgWARPTOMAP Allows mapping of data with associated latitude and longitude arrays.
![]()
cgADDTOPATH | |
| This utility program allows the user to add a new directory to the IDL !PATH system variable. |
cgAPPENDTOFILENAME |
|
| The purpose of this utility routine is to allow the user to append some text to the root name of a file. It is often used when a variable is changed for some reason, and you want to save the variable in a file with a different name. |
cgARROW | |
| This program draws an arrow on a graphics display. It is similar to the old Arrow command in IDL that now conflicts with the Arrow object in IDL 8. Set the WINDOW keyword to add this command to an cgWindow application. |
cgASPECT | |
This function calculates and returns the normalized position
coordinates necessary to put a plot with a specified aspect ratio
into the currently active graphics window. This makes it easy
to produce PostScript output in the correct dimensions for measuring.
For example, here is
how I create a plot that is 2 units tall and 3 units wide:
cgPlot, data, Position=cgAspect(2.0/3.0) The program has been updated to also work with a page of PostScript or Printer output. For example, I use it to keep the correct aspect ratio of a graphics plot when I send the plot directly to the printer (via the Printer device). For example, here is code I use in an object graphics program to make the graphics output appear on the printed page with the same aspect ratio as in the display window:
   info.thisWindow->GetProperty, Dimensions=wdims
   plotAspect = Float(wdims[1]) / wdims[0]
   windowAspect = 11.0 / 8.5 ; Letter page. Modify for A4 page.

	; Calculate the proper position on the PostScript page.

   position = cgAspect(plotAspect, WindowAspect=windowAspect)

	; Change the dimension and location of the view to page mapping.

   info.thisView->SetProperty, Dimensions=[position[2]-position[0], position[3]-position[1]], $
      Location=[position[0], position[1]], Units=3

      ; Print the document.

   info.thisPrinter->Draw, info.thisView, Vector=info.vector
   info.thisPrinter->NewDocument
|
cgAXIS | |
| This program is a wrapper for the AXIS command and is meant to work seamlessly with the other other Coyote Graphics programs in this device independent, color independent series. Set the WINDOW keyword to add this command to an cgWindow application. |
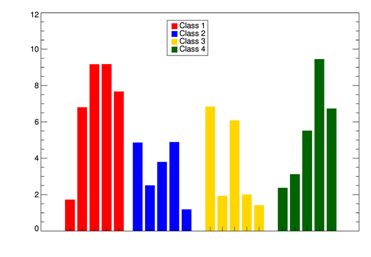
cgBARPLOT | |
| Draws data as a bar plot.
|
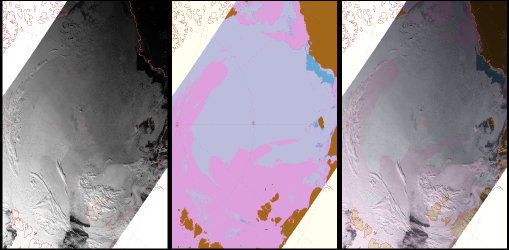
cgBLENDIMAGE | |
| This is an extremely simple program that will "blend" or "fuse" two 24-bit true-color
images using alpha blending. You set the alpha value to a number between 0 and 1 to select
the percentage of background image pixels to use in the blended image. For example, ALPHA=0.8
will use 80% of the background pixel values and 20% of the foreground pixel values in the
blended image. The program is a wrapper to the cgImage
command and can use all the features and keywords of that command. The figure below shows
two MODIS images on the left (MOD02) and middle (MOD29), and the blended image on the right. An ALPHA value
of 0.75 was used to create the blended image.
|
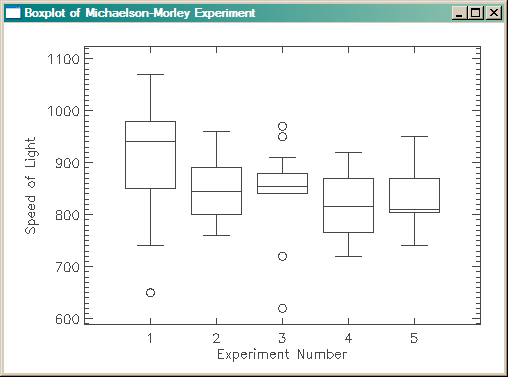
cgBOXPLOT | |
| Draws data as box and whisker plots. Here
is example output from plotting the Michaelson-Morely data from
their speed of light experiments.
|
cgCENTERTLB | |
| This utility routine simply calculates the offsets necessary to place or center a widget program on the display. Call the program after all the widgets have been created, but before the widgets are realized. |
cgCHECKFORSYMBOLS | |
| This function parses a text string for embedded cgSymbol characters and replaces them with the appropriate display or PostScript values to render the symbol. Symbols are embedded by prepending a "$\" to the start of the symbol name, and finishing with a "$" (e.g., $\Angstrom$). |
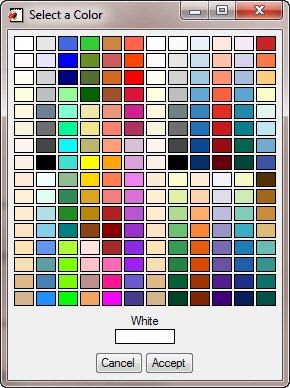
cgCOLOR | |
| This program is a completely device-independent program for specifying
colors by name. You can ask for and load any one (or all) of the nearly 200 colors
defined in the program by name.
The colors available are the ones defined for
the cgPickColorName program:
To see a list of all the colors available by name, type this:
   IDL> Print, cgColor(/Names), Format='(5(A14, 2x))'
         WHITE            SNOW           IVORY     LIGHTYELLOW        CORNSILK
         BEIGE        SEASHELL           LINEN    ANTIQUEWHITE          PAPAYA
        ALMOND          BISQUE        MOCCASIN           WHEAT       BURLYWOOD
           TAN       LIGHTGRAY        LAVENDER      MEDIUMGRAY            GRAY
     SLATEGRAY        DARKGRAY        CHARCOAL           BLACK        HONEYDEW
     LIGHTCYAN      POWDERBLUE         SKYBLUE  CORNFLOWERBLUE       CADETBLUE
     STEELBLUE      DODGERBLUE       ROYALBLUE            BLUE            NAVY
     PALEGREEN      AQUAMARINE     SPRINGGREEN            CYAN       TURQUOISE
 LIGHTSEAGREEN        SEAGREEN     FORESTGREEN            TEAL     GREENYELLOW
    CHARTREUSE       LAWNGREEN           GREEN       LIMEGREEN       OLIVEDRAB
         OLIVE       DARKGREEN   PALEGOLDENROD           KHAKI       DARKKHAKI
        YELLOW            GOLD       GOLDENROD   DARKGOLDENROD     SADDLEBROWN
          ROSE            PINK       ROSYBROWN      SANDYBROWN            PERU
     INDIANRED       CHOCOLATE          SIENNA      DARKSALMON          SALMON
   LIGHTSALMON          ORANGE           CORAL      LIGHTCORAL       FIREBRICK
       DARKRED           BROWN         HOTPINK        DEEPPINK         MAGENTA
        TOMATO       ORANGERED             RED         CRIMSON       VIOLETRED
        MAROON         THISTLE            PLUM          VIOLET          ORCHID
  MEDIUMORCHID      DARKORCHID      BLUEVIOLET          PURPLE       SLATEBLUE
 DARKSLATEBLUE             WT1             WT2             WT3             WT4
           WT5             WT6             WT7             WT8            TAN1
          TAN2            TAN3            TAN4            TAN5            TAN6
          TAN7            TAN8            BLK1            BLK2            BLK3
          BLK4            BLK5            BLK6            BLK7            BLK8
          GRN1            GRN2            GRN3            GRN4            GRN5
          GRN6            GRN7            GRN8            BLU1            BLU2
          BLU3            BLU4            BLU5            BLU6            BLU7
          BLU8            ORG1            ORG2            ORG3            ORG4
          ORG5            ORG6            ORG7            ORG8            RED1
          RED2            RED3            RED4            RED5            RED6
          RED7            RED8            PUR1            PUR2            PUR3
          PUR4            PUR5            PUR6            PUR7            PUR8
          PBG1            PBG2            PBG3            PBG4            PBG5
          PBG6            PBG7            PBG8            YGB1            YGB2
          YGB3            YGB4            YGB5            YGB6            YGB7
          YGB8            RYB1            RYB2            RYB3            RYB4
          RYB5            RYB6            RYB7            RYB8             TG1
           TG2             TG3             TG4             TG5             TG6
           TG7             TG8        OPPOSITE
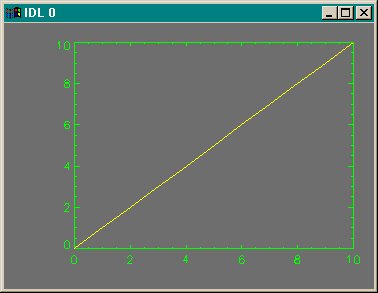
The normal calling sequence for producing device-independent drawing colors, will look similar to this. The first parameter is the name of the color you want, the second parameter is the color table index where you would like to load the specified color.
   axisColor = cgCOLOR("Green", !D.Table_Size-2)
   backColor = cgCOLOR("Dark Gray", !D.Table_Size-3)
   dataColor = cgCOLOR("Yellow", !D.Table_Size-4)
   Plot, Findgen(11), Color=axisColor, Background=backColor, /NoData
   OPlot, Findgen(11), Color=dataColor
If color decomposition is turned off, then the color is loaded at the specified index. If color decomposition is turned on, then no color is loaded into the color table. If a color index is not specified and color decomposition is turned off, then the specified color is loaded into the !P.Color index. The output of these commands looks like this:
The value that is returned by cgCOLOR depends upon the keywords used to call it and on the version of IDL you are using. In general, the return value will be either a color index number where the specified color is loaded by the program, or a 24-bit color value that can be decomposed into the specified color on true-color systems. If you are running IDL 5.2 or higher, the program will determine which return value to use, based on the color decomposition state at the time the program is called. If you are running a version of IDL before IDL 5.2, then the program will return the color index number. This behavior can be overruled in all versions of IDL by setting the DECOMPOSED keyword. If this keyword is 0, the program always returns a color index number. If the keyword is 1, the program always returns a 24-bit color value. If the TRIPLE keyword is set, the program always returns the color triple, no matter what the current decomposition state or the value of the DECOMPOSED keyword. This is useful, for example, if you want to load a color in the color table yourself.
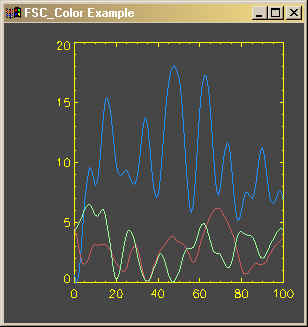
IDL> TVLCT, cgColor('dodger blue', /Triple), 10
If the ALLCOLORS keyword is used, then instead of a single value, modified as described above, then all the color values are returned in an array. In other words, the return value will be either an NCOLORS-element vector of color table index numbers, an NCOLORS-element vector of 24-bit color values, or an NCOLORS-by-3 array of color triples. This program can also read an ASCII file of color names and values, so you don't have to use the nearly 200 colors provided. And if you prefer to have the user select a color name, you can use the SELECTCOLOR keyword. (This requires cgPickColorName.) For example, suppose you want the RGB color triple of a user-supplied color. You would type this: IDL> color = cgCOLOR(/SelectColor, /Triple) IDL> Print, color The output keyword COLORSTRUCTURE is useful if you want to get all of the colors in a structure variable with the color names as fields in the structure. IDL> d = cgCOLOR(/AllColors, ColorStructure=c) IDL> Plot, Findgen(11), Color=c.green, Background=c.charcoal, /NoData IDL> OPlot, Findgen(11), Color=c.dodgerblue It is also possible to specify a vector of color names. For example, if you are overploting several lines in a plot, and you wish to each to have a different color, you might do this: x = Findgen(101) * 10/101. y = FltArr(3,101) FOR j=0,2 DO y[j,*] = cgDemoData(17) cgPlot, x, y[0,*], AxisColor='yellow', Background='charcoal', /NoData colors = ['dodger blue', 'indian red', 'pale green'] FOR j=0,2 DO cgPlot, x, y[j,*], Color=colors[j], /Overplot The plot might look something like this.
|
cgCOLORBAR | |||
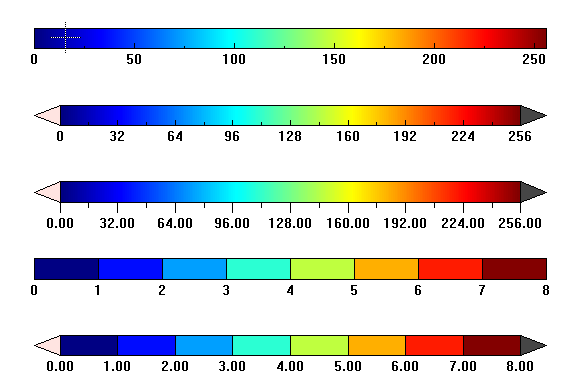
This program shows you one way to create a color bar for your programs.
This color bar appears exactly the same in a PostScript file as
it does on your display. You can easily create continuous or discrete color bars.
|
cgCOLORFILL | |
| This program is a wrapper for the POLYFILL command. It fills a polygon with a color or "texture." Set the WINDOW keyword to add this command to an cgWindow application. |
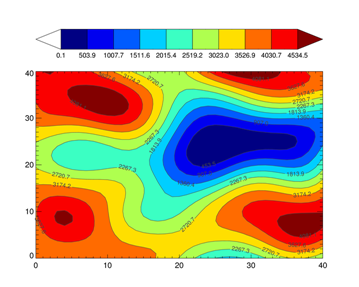
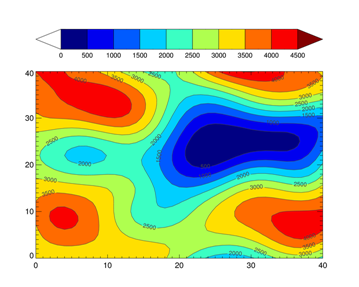
cgCONLEVELS | |||||
| The cgContour program specializes in producing equally spaced contour intervals. But, depending
on the data, the levels are not always "nicely" spaced or formatted. The role of the cgConLevels function
is to address this problem by providing an easy and intuitive way to produce contour levels that
look nice on contour plots.
Here is code that produces a "normal" contour plot with 10 equally-spaced contour intervals.
    cgDisplay, WID=0
    data = cgScaleVector(cgDemoData(2), 0.1, 4534.5)
    cgLoadCT, 33, NColors=10, Bottom=1
    cgContour, data, NLevels=10, /Fill, /Outline, $
       Position=[0.1, 0.1, 0.9, 0.75], C_Colors=Indgen(10)+1
    cgColorbar, NColors=9, Bottom=1, /Discrete, /Fit, $
       Range=[Min(data), Max(data)], OOB_High=10, OOB_Low='white'
Here is code that use cgConLevels to produce the contour levels.
    cgDisplay, WID=1
    data = cgScaleVector(cgDemoData(2), 0.1, 4534.5)
    cgLoadCT, 33, NColors=10, Bottom=1
    levels = cgConLevels(data, Factor=100, MINVALUE=0)
    cgContour, data, Levels=levels, /Fill, /Outline, $
       Position=[0.1, 0.1, 0.9, 0.75], C_Colors=Indgen(10)+1
    cgColorbar, NColors=9, Bottom=1, /Discrete, /Fit, $
       Range=[Min(levels), Max(levels)], OOB_High=10, OOB_Low='white'
|
cgCONTAINER | |
| This is a subclassed IDL_Container object that contains properties that are used with other Coyote Graphics routines. |
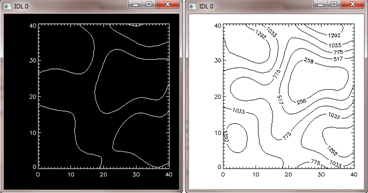
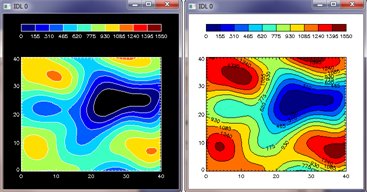
cgCONTOUR | |
| This program does for the CONTOUR command what
the cgIMAGE command did
for TV command. In other words, it makes the CONTOUR command
obsolete, by giving users a useable device-independent, color-independent tool
for producing graphics on modern computers. See the article
Device Independent Contour Plots
for additional information and screen shots. Below are pictures of basic Contour plots (on the left) verses
cgContour plots (on the right), in both regular and filled versions. Set the Window keyword to
add this command to an cgWindow application.
|
cgCONTROL | |
| This routine allows the user to control various internal properties of a cgWindow application, including the ability to load images with and without immediate execution and the ability to programmatically create PostScript and raster file output from the window. The program is essentially a conduit to the SetProperty method of the underlying cgWindow object. |
cgCOORD | |
| This is a subclassed cgContainer object that maintains a rectangular data coordinate system for other Coyote Graphics objects and programs. |
cgDBLTOSTR | |
| This utility routine converts a double-precision number to a string in a way that preserves all 14 significant digits. A more general form of this function is cgNumber_Formatter. |
cgDCBAR | |
| This program produces a discrete color bar with a handful, say 3 to 20 colors. Labels
are centered (either horizontally or vertically) for each color, and the labels can be
rotated, if needed, to keep an uncluttered display. The colorbar can be displayed either
horizontally or vertically anywhere in the display window. You can learn more about how
this program works by reading the Discrete Color Bar
article on my web page.
|
cgDEFAULTCOLOR | |
The purpose of this function is to choose a default color for Coyote Graphics routines. The input can be a string, a byte or integer, or a
long integer. If the input is a long integer, the function will evaluate
the value depending upon the current color state. If using indexed color,
and the long integer is in the range 0-255, the long integer is interpreted as a color table index number. The output is generally passed
to cgColor to obtain the actual
color used in the program.
    color = cgDefaultColor(inputColor, Default='Opposite')
    IF Size(color, /TNAME) EQ 'STRING' THEN color = cgColor(color)
|
cgDEFCHARSIZE | |
| This program selects the default character size for Coyote Graphics programs. Character size is based on several factors, including operating system, font type, and whether multiple plots are being displayed. In no case is the character size changed by the program if the !P.Charsize system variable is not set to its default value of 0.0. The character sizes returned are meant to emulate the slightly larger default character sizes used in the IDL 8 function graphics system. |
cgDELETE | |
| This command allows you to delete any or all cgWindow applications on the display. cgWindow applications can be selected by window index number, window title, widget identifier, or object reference. Set the ALL keyword to delete all the cgWindow applications on the display. |
cgDEMODATA | |
| This program is a utility routine for reading data files that are found in the IDL distribution, primairly in the $IDL_DIR/examples/data subdirectory. I use it when I teach IDL courses to get data of various types so I don't have to keep opening and closing files all the time. It is not particularly well written, but many of my code examples work better when you have a tool for loading data quickly. :-) |
cgDISPLAY | |
| This program is a wrapper for the WINDOW command. It erases a graphics window in a device and color independent way. Colors can be specified as color names. The default color is "white." This program automatically “protects ”the WINDOW command from devices that do not support windows. It is used to create IDL graphics windows in programs that are meant to work identically on the display and in other devices, such as the PostScript device, that do not support windows. If issued while in the PostScript device, a "window" with the same aspect ratio as the window that would be created on the display is specified. Using this program to open windows is one way to ensure your PostScript output looks identical to your display output. |
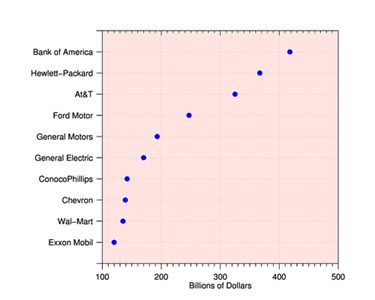
cgDOTPLOT | |
| A dot chart or dot plot is a statistical chart consisting of data points
plotted on a simple scale, typically with open or closed circles. This program
trys to imitate the dot plot found
on this web page.
|
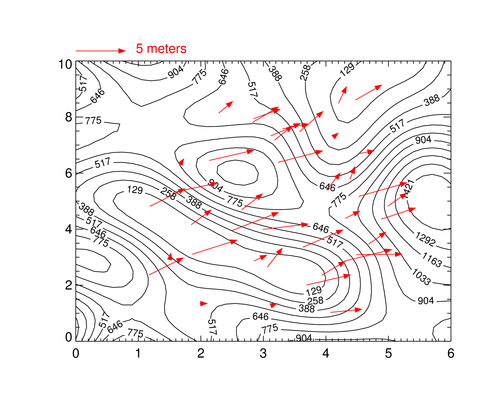
cgDRAWVECTORS | |||
This command is used to draw velocity vectors on a map or
other IDL graphics plot. This command is
similar to the NASA Astronomy Library routine PartVelVec, except that keywords make
it much easier to create a vector magnitude key and there are additional features,
such as the ability to draw vectors with solid arrowheads.
|
cgERASE | |
| This program is a wrapper for the ERASE command. It erases a graphics window in a device and color independent way. Colors can be specified as color names. The default color is "white." Set the WINDOW keyword to erase (delete) all the commands from an cgWindow graphics display before the display is erased with the specified color. |
cgERRORMSG | |
| The purpose of this utility routine is to have a device-independent way to create error messages. I like to write programs that use Dialog_Message to report errors to the user. But, of course, these error message don't work if I'm in the PostScript device rather than the X device. This program gives me the ability to write one error message and have it work appropriately for the device it is running on. Moreover, a Traceback keyword will give me accurate traceback information if this is used in conjunction with a Catch error handler. |
cgFINDPATHTO | |
| The purpose of this utility routine is to locate resource files such as data files, bitmap files, map files, etc. It looks in various places for those files, including "resource" and "resources" directories that it can find in likely places. Failing that, it will look in the IDL path for such files. |
cgFIXPS | |
| This program fixes IDL PostScript landscape output so that it is displayed in PostScript viewers right-side-up rather than upside-down. It currently works only with single page PostScript output, although directions for modifying multiple page PostScript output are available. |
cgGETCOLORSTATE | |
This program returns the current color decomposition state of a graphics device in a device-independent and version-independent manner. |
cgGRAPHICSKEYWORDS | |
| This program is an object that maintains a list of "graphics keywords" and their current values. Normally, Coyote Graphics objects will use this object as a superclass object to deal with the "common" keywords associated with most graphics routines without having to continually define the same keywords in programs. |
cgGREEK | |
This returns a Greek letter in a device-independent way for use in plot titles and other graphics annotation. Programs written using this function will work in your display window or in your PostScript file. The names of the Greek alphabet are shown below. 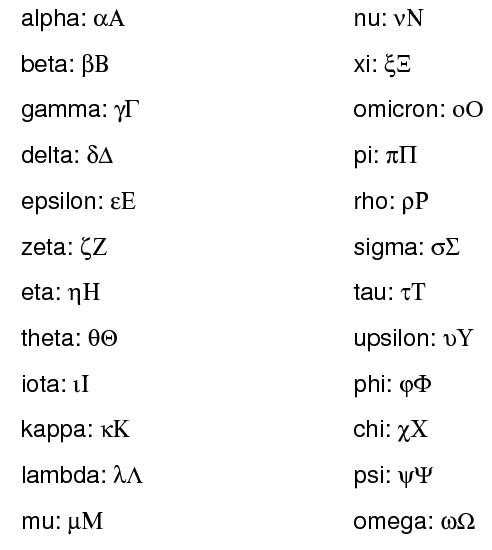 |
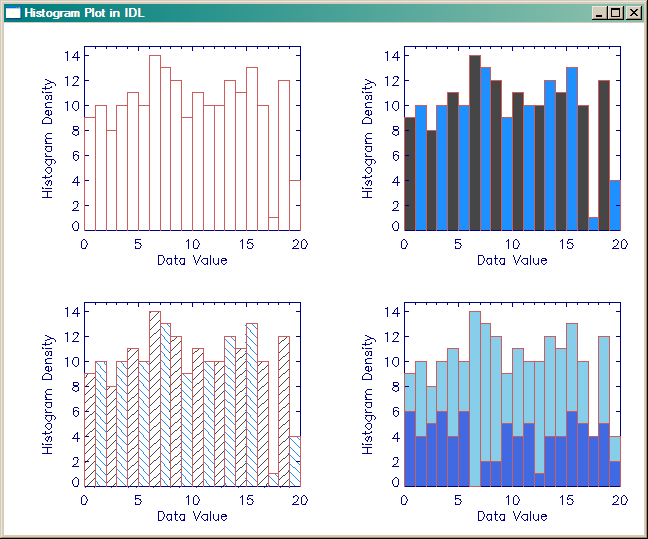
cgHISTOPLOT | |
| A program for drawing a histogram plot that actually looks like a histogram plot.
The histogram bars can be filled with lines (for black and white printing) or with
colors. By setting an OPLOT keyword, you can overplot histograms on already exisiting
axes. The cumulative probability distribution function can be obtained and/or plotted
on the histogram plot. Set the WINDOW keyword to
add this command to an cgWindow application.
|
cgHISTOGRAM | |
| This program is used as a wrapper to the Histogram command in IDL. It works around a bug in the Histogram command when byte data is binned in versions prior to IDL 8.2, and it takes care to match the data type of the BinSize keyword to the data type of the data being binned. If this matching is not done, Histogram silently returns incorrect results. I have added the ability to smooth the data (with the Smooth keyword) and to return the relative frequency of the histogram, rather than the histogram counts (with the Frequency keyword). The relative frequency is a number between 0 and 1. I have also added the ability to specify "missing" data that should not be binned. |
cgIMAGE | |
| This program is a wrapper for the TV and TVScl commands. You don't have to use this command, but you do have
to use a TV alternative command. Nothing in IDL will hold you back more from
improving your programming skills than the TV command.
I haven't used a TV command in 15 years, and you shouldn't use it either.
With the exception of cgColor, no program is more important and more powerful in
the Coyote Graphics System than cgImage.
Among the many features of the cgImage command are these:
|
cgIMAGEINFO | |
| This program works with cgIMAGE to allow the user to interactively determine image location and values for the displayed image. Further information is contained in this article on my web page. |
cgJULIAN2DATE | |
| This function converts a Julian number into a well-formatted date string of the form 16 Mar 2008 15:45:33. Input can be a scalar or an array of Julian numbers. There are 15 different formats for the date string, selected with the FORMAT keyword. |
cgKML_FEATURE | |
| This object implements the abstract Feature class in a KML file. A feature extends a KML object. |
cgKML_FILE | |
| This object implements and writes a KML file for display in Google Earth. See the KML Documentation for additional details. This is a partial implementation of the KML elements that go into a KML file. Initially, enough infrastructure was built to allow images to be added to KML files as GroundOverlay objects. Please check back frequently for updates and extensions to this code. |
cgKML_GROUNDOVERLAY | |
| This object implements a GroundOverlay element in a KML file. A ground overlay allows an image to be draped over the Google Earth terrain map. |
cgKML_LOOKAT | |
| This object implements the abstract LookAt class in a KML file. A LookAt tag allows the user to "fly to" a particular location and elevation over the surface of the Earth. |
cgKML_OBJECT | |
| This object implements the abstract Object class in a KML file. An Object class ia a basic KML class and is normally inherited by almost every other KML class. |
cgKML_OVERLAY | |
| This object implements the abstract Overlay class in a KML file. An Overlay extends a KML Feature class. |
cgKML_SCREENOVERLAY | |
| This object implements a ScreenOverlay element in a KML file. A screen overlay allows an image to be located at an permanent location on the Google Earth display. It is useful for creating color bars and legends for ground overlays. |
cgKML2KMZ | |
| This program simply collects files created from the cgImage2KML program and moves the files to a zip file with a *.kmz file extention. The method used is an undocumented and unsupported method for creating KMZ files in IDL 8. It should not be relied upon, and it will not work in earlier versions of IDL. The cross-platform zip file functionality is scheduled to be exposed to IDL users in an IDL release sometime in 2013, but it is not known when or if this will occur. |
cgKRIG2D | |
| This function interpolates a regularly or irregularly sampled set of points of the form z = f(x, y) to produced a gridded 2D array using a statistical process known as kriging. It is orders of magnitudes faster than the Krig2D command supplied with IDL up through version IDL 8.2.3. |
cgLAYOUT | |
The purpose of this program is to return the normalized position coordinates for
a line plot, contour plot, or image plot with a specific "layout" in the current
graphics window. A "layout" has a specified grid of columns and rows organized
inside a graphics display window. This program is particularly useful for laying
out !P.Multi-like plots with additional annotation, such as color bars associated
with them. Here, for example, is how I would create a 2 by 2 grid of images, each
with an associated color bar.
   cgDisplay, WID=1
   cgLoadCT, 22, /Brewer, /Reverse
   pos = cgLayout([2,2], OXMargin=[5,5], OYMargin=[5,12], XGap=3, YGap=10)
   FOR j=0,3 DO BEGIN
       p = pos[*,j]
       cgImage, cgDemoData(18), NoErase=j NE 0, Position=p
       cgColorBar, position=[p[0], p[3]+0.05, p[2], p[3]+0.1]
   ENDFOR
   cgText, 0.5, 0.925, /Normal, 'Example Image Layout', Alignment=0.5, $
       Charsize=cgDefCharsize()*1.25
You see the result in the figure below. 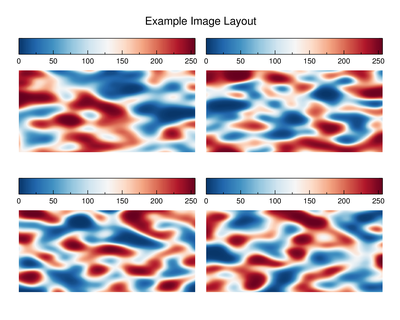 |
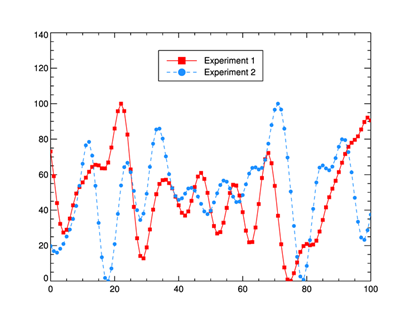
cgLEGEND | |
| This routine is used to create a legend in a graphics display. Details can be
found in the on-line help or in the
article Adding a Legend to a Coyote Graphics Window.
An example of such a legend is shown in the figure below.
|
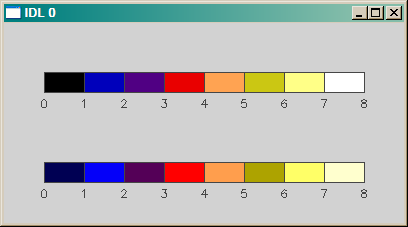
cgLOADCT | |
| A utility routine that is a drop-in replacement for LOADCT, with additional
functionality and a correction to one of my favorite pet peeves. A REVERSE keyword
allows the user to reverse the color table vectors prior to loading. A CLIP keyword
allows the user to clip the normal color table vector to just a portion of the
original color table vectors. I find this useful, for example, when I want a reduced
number of colors in the color table, and I want to exclude the color table end-colors
(for most IDL color tables these are black and white).
For example, suppose I wish to use the Standard Gamma color table (color table 5), but I wish to exclude, the black color at the bottom, and the white color at the top. I might type: "cgLOADCT, 5, CLIP=[16,240]". The color bar at top in the figure below was created by loading colors with this command: IDL> LoadCT, 5, NCOLORS=8 The color bar below was created by loading colors with this command: IDL> cgLoadCT, 5, NCOLORS=8, CLIP=[16,240]
In addition, one of my favorite pet peeves is corrected by having all color table loading done silently. Updated on 14 May 2008 to support Brewer Colors. You will need to download the fsc_brewer.tbl file from Coyote Library to use this functionality. Install it either in the $IDL_DIR/resource/colors directory or in any directory in the IDL path. |
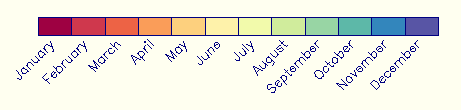
cgMONTHS | |
| This utility routine simply returns the names of the months in various formats. It is useful for labeling graphics displays and so forth. The user can ask for a specific month by giving a month index. Formats, in addition to the normal months, include all capital letters, three-letter abbreviations, and single letters. |
cgNUMBER_FORMATTER | |
| This utility routine converts a number to a string. I use it primarily to convert numbers I wish to display in a text widget. It allows you to specify how many decimal places you would like to have in the output. This is much more flexible than IDL's normal string formatting functions, and it works with all types of numerical values. |
cgOBJ_ISA | |
| This program is similar to the built-in Obj_Isa program, except that it can handle undefined arguments and arrays. |
cgOTSU_THRESHOLD | |
| The purpose of this function is to find an optimal threshold for separating a bimodal distribution of pixels in an image histogram. The Otsu Threshold method is used to find the threshold. |
cgNORMALIZE | |
| I find the scaling factors that have to be passed to the [XYZ]Coord_Convert keyword to get graphics primitives arranged properly in my graphic views impossible to understand. Here is a program that allows me to specify the primitive's data range (obtained from the primitive itself) and a position in my arbitrary coordinate system and it calculates the proper scaling factor automatically. I could not write object graphics programs without it. This is a program that is used in all of my object graphics programs. |
cgPERCENTILES | |
| This program calculates user-specified percentiles of a data set. A percentile is the value of a variable below which a certain percent of observations fall. In other words, 75% of the values in a data set fall below the 75th percentile of the data. A box-and-whisker plot usually will display the 25th, 50th, and 75th percentiles of the data. |
cgPICKFILE | |
| This utility program is a wrapper for Dialog_Pickfile, except that it remembers the directory location of your last selection and, optionally, the last file name selected. Keywords allow me to find files in my IDL directories easily. |
cgPLOT | |
| This program does for the PLOT command what the cgIMAGE command did for TV command. In other words, it makes the PLOT command obsolete, by giving users a useable device-independent, color-independent tool for producing graphics on modern computers. Set the WINDOW keyword to add this command to an cgWindow application. |
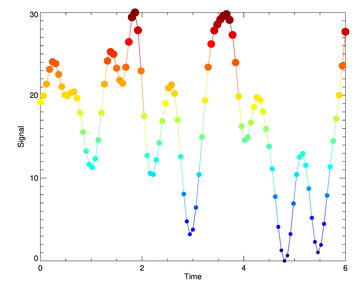
cgPLOTS | |
This program is a device-independent, color-independent wrapper for the PLOTS command.
Data colors (Color keyword), symbol colors (SymColor keyword), and symbol size (SymSize keyword)
can all be vectors, unlike the PLOTS command. This allows you to draw plots with multicolored lines, multicolored symbols, and/or multisized symbols. Set the WINDOW keyword to
add this command to an cgWindow application.
   IDL> data = cgDemoData(1)
   IDL> time = cgScaleVector(Findgen(101), 0, 6)
   IDL> LoadCT, 33, /Silent
   IDL> cgPlot, time, data, /NODATA, XTITLE='Time', YTITLE='Signal'
   IDL> cgPlotS, time, data, PSYM=-16, COLOR=BytScl(data), $
           SYMCOLOR=BytScl(data), SYMSIZE=cgScaleVector(data, 1.0, 2.5)
|
cgPOLYGON | |
| This command allows you draw a filled or unfilled polygon on the display. Polygons can be created in two or three dimensions, and the fill color can be different from the polygon outline color. |
cgPS2PDF | |
| This program takes advantage of third-party free software (Ghostscript, pstopdf, epstopdf, etc.) to create a machine independent way to create PDF files from PostScript intermediate files. It is not my intention to reinvent the wheel, but I did need a way to create PDF files automatically from within a cgWindow program, and this program does the job. On-line documentation for this program is available. |
cgPS2RASTER | |
| This program takes advantage of the ImageMagick convert command to convert PostScript intermediate files to BMP, GIF, JPEG, PNG, or TIFF raster files in a machine independent way. On-line documentation for this program is available. |
cgPS_CONFIG | |
| This program is a simplified wrapper function for FSC_PSConfig,
my new program for configuring the PostScript device. It is essentially a drop-in
replacement for PS_Form, an older program with similar functionality. It provides
access to FSC_PSConfig's graphical user interface for allowing
the user to configure the PostScript device, and it returns the necessary keywords
for configuring the PostScript device in exactly the same way PS_Form does.
Most of the PS_Form keywords can also be used to set the initial properties of
the graphical user interface. Be sure to read the
FSC_PSConfig on-line help for instructions.
You can download all of the programs you need from theCoyote Library. 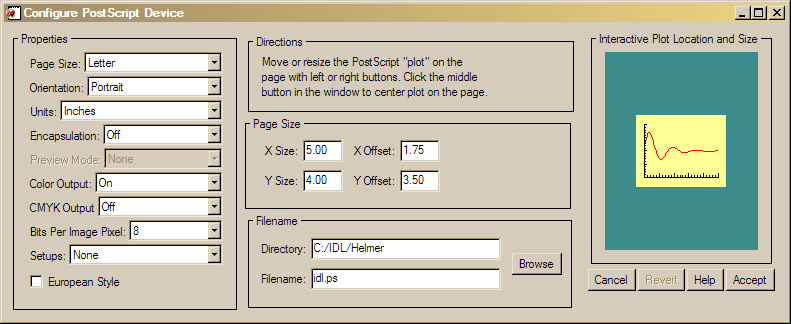 The program is used like this: keywords = cgPS_Config(Cancel=cancelled) IF cancelled THEN RETURN thisDevice = !D.Name Set_Plot, 'PS' Device, _Extra=keywords cgPlot, findgen(11) ; Or whatever graphics commands you use. Device, /Close_File Set_Plot, thisDevice The program is now updated (9 November 2007) to allow CMYK output. |
cgPS_OPEN/cgPS_CLOSE | |
| These two programs (in the same file) are wrappers that allow easy configuration
of PostScript output. In addition to making PostScript set-up effortless, if
ImageMagick is installed
on your machine, then you can immediately convert your PostScript output to JPEG, PNG,
or TIFF image output. The advantage of this is that your Web output takes advantage
of nice PostScript fonts.
Here is an example of creating a line plot in a PostScript file named lineplot.ps and at the same time creating a PNG file named lineplot.png for display in a browser: cgPS_Open, FILENAME='lineplot.ps' cgPlot, Findgen(11), COLOR='navy', /NODATA, XTITLE='Time', YTITLE='Signal' cgOPlot, Findgen(11), COLOR='indian red' cgOPlot, Findgen(11), COLOR='olive', PSYM=2 cgPS_Close, /PNG The programs interface with cgPS_Config to configure the PostScript device, so any keywords appropriate to cgPS_Config (and there are a lot of them) can be used with cgPS_Open. Numerous programs from the Coyote Library are required with these programs, but be sure you get a new version of FSC_PSConfig if you are just downloading this file. |
cgPSDIMS | |
| This program reads a PostScript file to find the Bounding Box and from the values it finds there returns a 2D dimensions array [xsize, ysize]. |
cgPSWINDOW | |
| This function is used to calculate the size of a PostScript window that has the same aspect ratio (ratio of height to width) as the current display graphics window. It creates the largest possible PostScript output window with the desired aspect ratio. This assures that graphics output looks similar to, if not identical to, PostScript output. This program has been updated with a PRINTER keyword that makes it useful for calculating an output window on the PRINTER device page as well. |
cgQUERY | |
This command allows
you obtain information about all the cgWindow applications currently on the display.
You can obtain their window index numbers, the identifiers of their top-level base
widgets, their window titles, and their object references. If the CURRENT keyword is
set, the same information can be obtained for just the current cgWindow application.
IDL> windowIDs = cgQuery(WIDGETID=tlbIDs, OBJECTREF=objRefs, TITLE=winTitles, COUNT=count) IDL> FOR j=0,count-1 DO Print, windowIDs[j], ' ', winTitles[j] |
cgRANDOMINDICES | |
This command allows the user to select a certain number of random indices out of a
selection vector. The indices are selected without replacement, which means you get a list
of unique indices. (None are repeated.) For example, to select 10 random indices out of
a vector of 100 random indices, you would type this.
   IDL> indices = cgRandomIndices(100, 10, SEED=seed)
   IDL> Print, indices
        7  13  20  21  32  44  50  66  80  93
|
cgRANDOMWALD | |
This command returns random numbers based on an
Inverse
Gaussian Distribution of numbers. This is also known as a Wald Distribution.
   IDL> numbers = cgRandomWald(seed, 5)
   IDL> Print, numbers
        0.35932975   0.47249304    1.8922137   0.33552555   0.74778911
|
cgRESIZEIMAGE | |
| This program is a substitute program for Congrid, specifically for sizing 2D and true-color images, without the weaknesses of the Congrid command. Interpolation always occurs at pixel centers, so that resized pixels do not change their image "location." True-color (or 3D) images can be resized with nearest neighbor sampling, unlike with the Congrid command. See Resizing Images for additional detailed information. |
cgRESIZERASTER | |
| This resizes a raster file in known format (e.g., JPEG, PNG, TIFF, etc.) to either a smaller or larger size. It was written primarily to resize the huge raster files produced by IDL's function graphics commands to a size that is easily handled in a web page or in e-mail. The default is to resize a file so that its largest dimension is about 600 pixels, but the user can choose other options to match the application the raster file is intended to be used in. |
cgROOTNAME |
|
| The purpose of this utility routine is to allow the user to obtain the base file name, the directory name, and the file extension in a single call. It is similar to the built-in routines FILE_DIRNAME and FILE_BASENAME, but more convenient to use in most situations. |
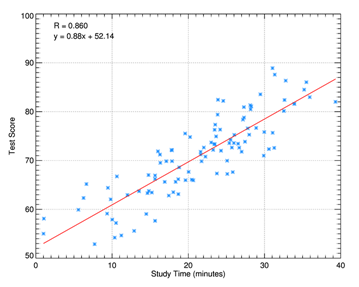
cgSCATTER2D | |
| This program allows you to create a scatter plot between two variables.
It is similar to a plot command, but in addition it optionally calculates the Pearson
correlation coefficient and plots a best-fit straight line though the data.
The fitting parameters can be retrieved from the program and/or displayed on the
data plot. On-line documentation for
the program is available.
|
cgSETCOLORSTATE | |
This program set the current color decomposition state of a graphics device in a device-independent and version-independent manner. An output keyword, CurrentState, is availabe to return the current color decomposition state of the device at the time it is set. This avoids a problem with UNIX machines obtaining the state in a different way than Windows machines. |
cgSNAPSHOT | |
| This program is a device independent replacement for the IDL TVRD program. It returns an 8-bit image when called on 8-bit displays and a 24-bit pixel interleaved image when called on 24-bit displays. Optional keywords can produce BMP, GIF, JPEG, PICT, PNG, and TIFF file output automatically. |
cgSNAKE | |
This program is similar to the
ActiveContour program in that it implements the Gradient Vector Flow
active contouring method of Xu and Prince. It differs in that it does so without
requiring an interactive GUI. In other words, the GVF algorithm can be applied to
a 2D dataset as a function, in the manner of other image processing functions.
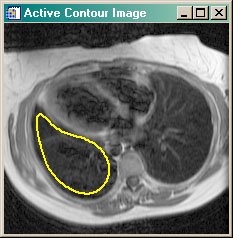
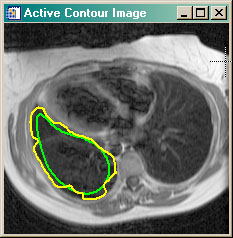
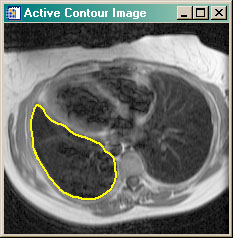
The program requires that the GVF_Snake program be purchased from the Coyote Store. You can read more about active contouring in the article Active Contouring (Snakes) in IDL. |
cgSURF | |
| This program does for the SURFACE and SHADE_SURF commands what the cgIMAGE command did for TV command. In other words, it makes the SURFACE and SHADE_SURF commands obsolete, by giving users a useable device-independent, color-independent tool for producing graphics on modern computers. Set the WINDOW keyword to add this command to an cgWindow application. |
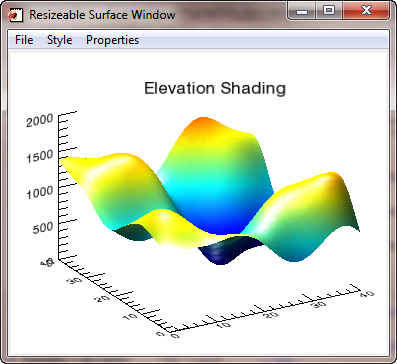
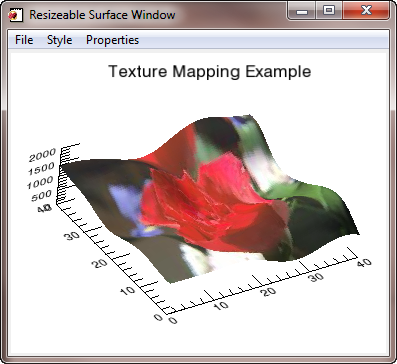
cgSURFACE | |||||
| This program has been completely re-written in Nov 2010 to be a fully-capable
surface command along the lines of the traditional surface command, cgSurf.
It uses most of the the same keywords and acts in a similar fashion, but adds a great deal
more functionality, including interactivity. Users can rotate and zoom into and out of the surface
with the mouse, change colors and other surface properties at will, and save the surface
to a number of output file types, including PostScript. Four lights illuminate the surface,
and users have complete control over the color and intensity of these lights. The lights
can be turned on or off to change surface features. Any 2D or true-color image can be added
to the surface as a texture map.
This program won the IDL Code Contest, sponsored by Research Systems, Inc. to inaugurate their User Contribution Library in November 2002.
| |||||
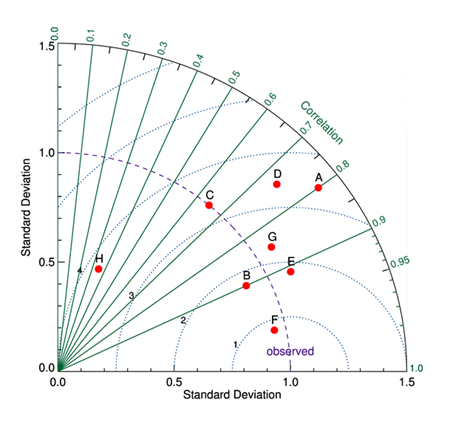
cgTAYLORDIAGRAM | ||||
This program implements a
Taylor Diagram from user data. A Taylor diagram can represent three different
statistics (centered root-mean-squared (RMS) distance, correlation, and standard
deviation) simultaneously in one two-dimensional plot. According to the IPCC:
"Taylor diagrams provide a way of graphically summarizing how closely a pattern (or a set of patterns) matches observations. The similarity between two patterns is quantified in terms of their correlation, their centered root-mean-square difference and the amplitude of their variations (represented by their standard deviations). These diagrams are especially useful in evaluating multiple aspects of complex models or in gauging the relative skill of many different models."
| ||||
cgSET | |
| This command is the equivalent of the WSet command for normal IDL graphics windows. It allows you to select a cgWindow application on the display and make it the "current" cgWindow application. Graphics commands are normally added to the current graphics display window. cgWindow applications can be selected by window index number, window title, widget identifier, or object reference. |
cgSET_TTFONT | |
| This command allows the user to set the name of the True-Type font that should be used for PostScript and raster file output. |
cgSHOW | |
| This command is the equivalent of the WShow command for normal IDL graphics windows. It allows you to move a cgWindow application forwand on the display without making it the "current" cgWindow application. Graphics commands are normally added to the current graphics display window. cgWindow applications can be selected by window index number, window title, widget identifier, or object reference. |
cgSOURCEDIR | |
This is a utility routine that allows you to distribute IDL program libraries and find
application sub-directories relative to the directory containing the program that is currently
running. In other words, your end-users need only include directories relative to the
main program directory. You won't care where on their hard drive they place them!
If your directory structure looks like this:
   .../myapp
   .../myapp/data/resources
You can find your icon resources file, myicon.ico, like this: filename = Filepath(Root_Dir=cgSourceDir(), Subdirectory=['data','resources'], 'myicon.ico') This program is a must if you distribute IDL program libraries. |
cgSYMBOL | |
| This command allows you to create device independent Greek (φ, ξ, λ, etc.) and other symbols (Å, ≠, ≡, etc.) in your IDL programs. The symbols produced will work correctly on the display and in a PostScript file. See the article Using Greek Symbols for additional information. Symbols can be embedded into text strings in Coyote Graphics routines. |
cgSYMCAT | |
This function provides a way of specifying 46 different plotting symbols
for use with graphics commands such as PLOT and OPLOT. The return value of the
function is used as input to the PSYM keyword. For example, to display a plot with
star symbols (symbol number 45), you would type this:
Plot, cgDemoData(1), SymSize=2, PSym=cgSYMCAT(45) Symbols can also be asked for by name (e.g., "star" or "-star"). Coyote Graphics plotting routines can take advantage of this capability automatically. cgPlot, cgDemoData(1), SymSize=2, PSym="-star" |
cgTEXT | |
This program is a wrapper for XYOUTS and is meant to work seamlessly with the other
cg*** programs in this device independent, color independent series. It can choose
its color based on the background color of the graphics window. If the PLACE keyword is
set, the user can click inside the current graphics window to set text at the cursor
location. Set the WINDOW keyword to
add this command to an cgWindow application.
IDL> cgText, 0.5, 0.5, 'Centered Text', /ALIGNMENT=0.5, COLOR='dodger blue' IDL> cgText, /PLACE, 'Use CURSOR to Locate this Text', COLOR='red8' |
cgTIMESTAMP | |
This utility routine creates a time stamp in one of 11 different formats. Optionally,
a sequence of any number of random digits can be appended to the time stamp. Local or
UTM time can be specified. And the time stamp can be formatted in a way that is appropriate
for use in an IDL variable name.
   IDL> FOR j=0,10 DO Print, cgTimeStamp(j)
      _sun_feb_07_21:24:54_2010
      _Sun_Feb_07_21:24:54_2010
      _07_02_2010_21:24:54
      _07022010_21:24:54
      _07022010
       _07Feb2010_21:24:54
      _07feb2010_21:24:54
      _07FEB2010_21:24:54
      _02_07_2010_21:24:54
      _02072010_21:24:54
      _02072010
|
cgTRANSPARENTIMAGE | |
Creates a transparent image either from a supplied image or from an IDL graphics window. The missing "color" can be specified as the name of a color, as a color index (for 2D images) or as a color triple. Optionally, the transparent image can be saved as a transparent PNG file. Here is an example of some commands to display a transparent image. cgDisplay, WID=0 cgImage, cgDemoData(5), CTIndex=0, /Interp timage = cgTransparentImage(COLOR='black', TRANSPARENT=50) cgDisplay, WID=1 cgImage, cgDemoData(7), CTIndex=22 cgImage, timage 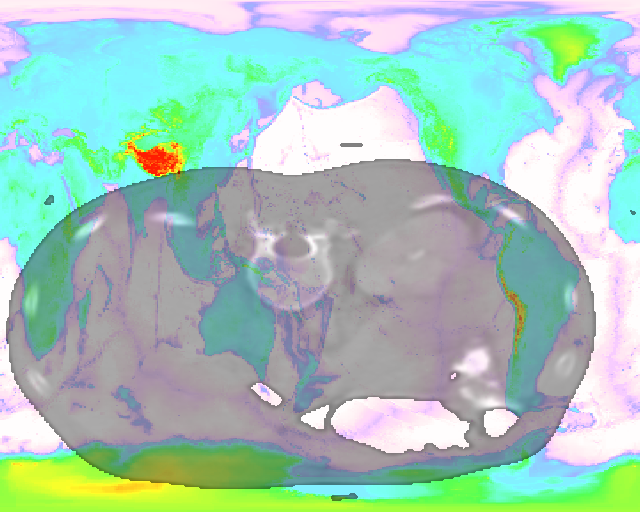 |
cgWHOAMI | |
| This program simply identifes the program module containing this function. |
cgWHOCALLED | |
| This program simply identifes the program module that called this function. |
cgWINDOW_GETDEFS | |
| This routine allows the user to get global default values for configuring cgWindow. |
cgWINDOW_SETDEFS | |
| This routine allows the user to set global default values for configuring cgWindow. |
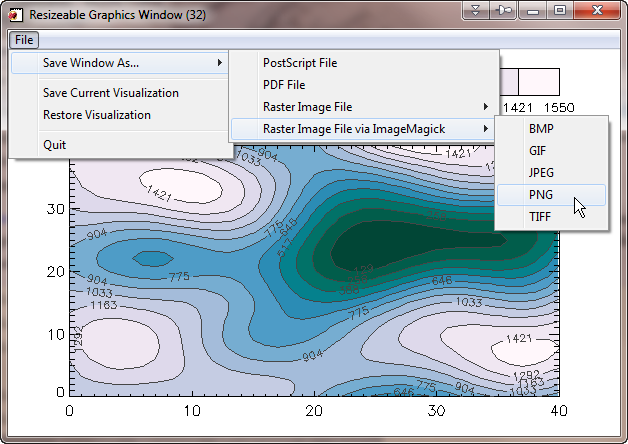
cgWINDOW | |||
| This command is a resizeable graphics
window for displaying IDL graphics commands. In addition to resizing the graphics window, this command can create
BMP, GIF, JPEG, PNG, TIFF raster files, as well as true PostScript output. This command is invoked automatically by setting
the Window keyword on Coyote Graphics routines.
If ImageMagick is available on your machine, you will have the additional option of making raster image
files of the window contents directly from PostScript files. This completely eliminates any concern for
poor quality fonts in raster file output.
The cgWindow program can accept multiple graphics commands. Commands can be added, deleted, replaced, and listed. Multiple cgWindow programs can be opened at once, and you have easy access to the commands in any graphics window. Here is an example of how to display a filled contour plot with a color bar.
   IDL> cgLoadCT, 4, /Brewer, /Reverse, NColors=12, Bottom=1
   IDL> cgWindow, 'cgContour', cgDemoData(2), NLevels=12, /Fill, C_Colors=Indgen(12)+1, $
           Position=[0.1,0.1,0.9,0.75]
   IDL> cgWindow, 'cgContour', cgDemoData(2), Color='Charcoal', NLevels=12, /Overplot, /AddCmd
   IDL> cgWindow, 'cgColorbar', Divisions=12, Range=[Min(data), Max(data)], NColors=12, $
            Bottom=1, XMinor=0, XTicklen=1.0, /AddCmd
If used with Coyote Graphics routines (by setting the WINDOW keyword), cgWindow can be used in exactly the same way normal IDL graphics windows are used. That is to say, resizeable, smart graphics windows are available for all IDL users. |
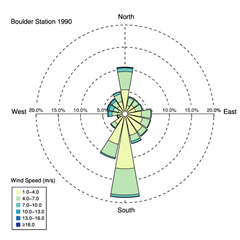
cgWINDROSE | |||
This command creates a wind rose diagram from wind speed and direction data.
There is an example using the program in the
Coyote Plot Gallery.
|
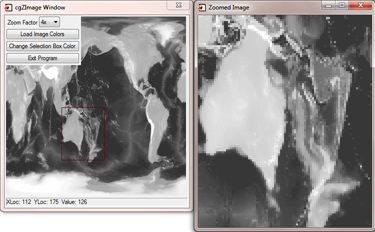
cgZIMAGE | |
This program allows you to "zoom" into a portion of an image.
It illustrates how to use pixmaps and the "device copy" technique to
create a rubberband box on top of an image. It also illustrates a
very powerful technique of having several event handlers for an
individual widget and switching between them. The image location
and the image value at that location is output in a status bar widget
in newer versions of this program. This makes your programs
more modular and easier to maintain. Right clicking in the image
window pulls up hidden zoom controls. (For the equivalent program written with object graphics,
see ZOOMBOX.)
 |
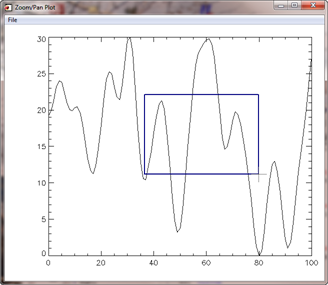
cgZPLOT | |
This routine allows the user to interact with a line plot created with cgPlot.
Users can zoom and pan into the line plot display. There is a multiple undo and redo
capability, and users can "tweak" the zoom by clicking the LEFT mouse button outside
of the plot boundaries. Clicking inside the plot boundaries with the LEFT mouse button
will allow a rubberband-box zoom in both the X and Y directions. A button is available
that can "adjust" the Y range of the zoomed-in plot to completely show the values
indicated by the X range of the zoomed-in plot. Combined with Undo and Redo (all
implemented at key combination shortcuts), this allows the user to "pull-in and back-out"
of zoomed plots. The RIGHT mouse button allows fast panning of the plot in the display
window. The program is written as a stand-alone application, but it is also a
compound widget object, which means you can have a zoom/pan window in your own
IDL application.
|
![]()
Version of IDL used to prepare this article: IDL 7.0.1.
![]()
![]()


