|
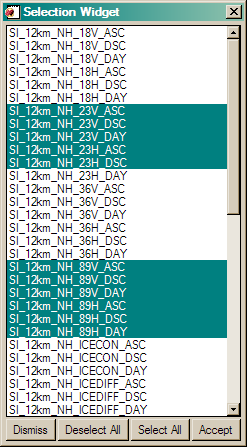
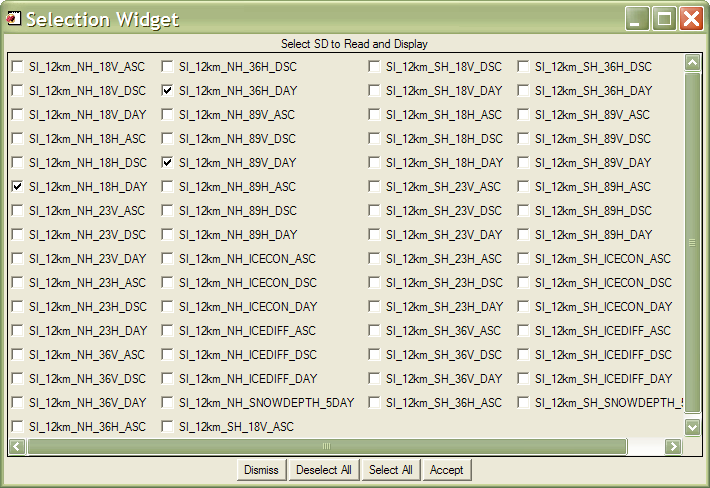
This utility routine is a pop-up dialog widget that allows the user to select one
or more "names" from a string array of names. I use it to give the user a list of scientific
data sets inside an HDF file. This program is similar to
Name_Selector, but I find it easier to use and
make selections when you have a large number of selections.

|
|
|
This utility program allows you to obtain the maximum size of an unobstructed graphics
window in a device independent way. A graphics window constructed of this size is about
as large as the display, but is not obstructed by tool bars, task bars, start bars, etc.
|
|
|
|
This utility program allows the user to to print the maximum and minimum of a variable.
|
|
|
|
This utility routine is a pop-up dialog widget that allows the user to select one
or more "names" from a string array of names. I use it to give the user a list of scientific
data sets inside an HDF file. I will read and display the selected scientific data sets from
the file. This program is similar to
List_Selector.
|
|
|
|
This simple utility just copies the contents of an IDL direct graphics window
and sends it directly to the default printer, represented by the PRINTER device.
Care is taken to preserve the aspect ratio of the window and to create as large
an image as possible on the output page.
|
|
|
|
This simple object implements a "progress bar". If you compile the program,
you will find an example program, named Progressbar_Example,
that will show you how to operate the cgProgressBar object.

|
|
|
|
Unless you are careful in IDL, your random numbers may not be all that random.
(See Random Numbers Are...Uh, Repeating.)
This RandomNumberGenerator object will protect your random number seed so that you
can continue to generate random number sequences from any of your program modules.
Perhaps the best way to make random numbers available to your IDL programs is to
make this random number generator object a system variable that can be accessed by
any IDL program module.
   IDL> DefSysV, '!RNG', Obj_New('RandomNumberGenerator')
   IDL> randomNumbers = !RNG -> GetRandomNumbers(3)
   IDL> Print, randomNumbers
        0.089239137      0.77428782     0.069180504
Any keywords and parameters appropriate for the IDL RandomU function can be used
with this object.
|
|
|
|
This utility program returns the range ([minimum, maximum]) of a vector or array.
|
|
|
|
This utility program replicates or tiles a 2D matrix or array by an integer number
of colums and rows. It is similar to the MatLab RepMat command.
|
|
|
|
When save objects are restored, they are almost always restored without their methods.
That is to say, the object code has not yet been compiled when an object is restored, so
it is not possible to call a method on a restored object without encountering an error. This
Resolve_Object program solves the problem in an efficient way by compiling object and superclass
object methods only if they need to be compiled. Simply restore your object, and then pass it to
Resolve_Object and you are ready to use your object normally.
|
|
|
|
This utility program allows the user to save or export a variable to the main IDL level (normally
where IDL commands are typed) from within a procedure or function. I use it when debugging code
and I want to save an image to the main IDL level for further inspection with other interactive
programming tools.
|
|
|
|
This program is
more or less a drop-in replacement for the Window command in IDL, with this significant
difference: if the requested graphics window size is larger than the display size, the
graphics window is returned in a scrollable base widget so the user can scroll around
in the larger graphics window. I find this program useful when I need to create
large windows on my desktop machine, but still want to be able to see the full-resolution
output on my laptop, which has a lower resolution display. |
|
|
|
This utility program sets the default values for positional and
keyword arguments to IDL commands.
|
|
|
|
The purpose of this program is to provide an efficient algorithm for sorting an array by individual
rows. The program, described by JD Smith, the author, “as a friend to HIST_ND”, was the result of a
long discussion on this topic on the IDL newsgroup. This was the most efficient algorithm of several
that were offered and discussed. It is offered here with JD's permission.
|
|
|
|
This function allows you to calculate a character size for a particular
string, so that the string width is close to a specified target width
in the current graphics window. The function is particularly useful
with respect to sizing strings in resizeable graphics windows. The target
width is specified in normalized units.
|
|
|
|
This small utility program can take a long line of text and break it into a string array at
some arbitrary maximum length. I find it useful for breaking up a long error message produced
with MESSAGE into a string array suitable for display in DIALOG_MESSAGE.
|
|
|
|
There has been extensive discussion lately on the IDL newsgroup about the most efficient
method for rotating volumetric data. Several algorithms were tried and discussed. This algorithm,
by Martin Downing in the UK, is the current favorite. It processes the volume in "chunks", which
could, in theory, make it suitable for parallelization.
|
|
|
|
This is a simple utility program
to delete or undefine a variable from within an IDL program. It is a more powerful
version of DelVar, which can only be used at the main IDL level.
|
|
|
|
This small utility program can determine if a specified IDL graphics window is currently open
and available to receive graphics commands.
|
|
|
|
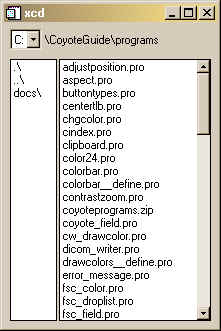
This simple utility routine for changing directories is written
by Paul Sorenson and included here with his permission. It works on VMS and Windows
machines only. This is one of those incredibly useful programs that make you think:
"Now how come I didn't think of that!" It is an
excellent example of how to write a widget program with an object-oriented design.
All the programs you need are available in this zip file.
|

Version of IDL used to prepare this article: IDL 7.0.1.
Copyright ©
1996–2018 Fanning Software Consulting, Inc.
Last Updated: 21 March 2011
|