.\
cglayout.pro
top cgLayout
Graphics, Utilities
result = cgLayout(layout [, ASPECT=float] [, IXMARGIN=integer] [, IYMARGIN=integer] [, OXMARGIN=integer] [, OYMARGIN=integer] [, UNIT=float] [, XGAP=integer] [, YGAP=integer])
The purpose of this program is to return the normalized position coordinates for a line plot, contour plot, or image plot with a specific "layout" in the current graphics window. A "layout" has a specified grid of columns and rows organized inside a graphics display window. This is similar to the positions calculated by !P.Multi, although a great deal more flexible. Of course, with additional flexibility and power comes more responsibility. You will be required to use the NoErase keyword correctly and you will be responsible for setting the character size on your plots. These jobs are normally handled by !P.Multi. Some users will find this liberating, some will find it a pain in the keister. There is always !P.Multi to go back to.
A grid position is a combination of the number of columns and rows desired, plus the application of inside and outside margins, as well as a desired aspect ratio. Margins are specified in units of one-third the !D.X_PX_CM value to be device independent. The outside margins locate the grid inside the graphics display window. (These are equivalent to !X.OMargin and !Y.OMargin system variable when displaying a grid with !P.Multi, for example.) Inside margins use the same units, but are used to modify the initial grid positions in the window. (These are equivalent to using the XMargin and YMargin keywords on a plot command.) For example, inside margins might be used to leave room inside a larger position for color bars or other annotations you wish to put on a graphics display. The aspect ratio modifies the grid position after the outside and inside margins have been applied to create the final grid position, which will be centered in its initial grid position.
Return value
This function returns the normalized position coordinates for a particular location in a grid of locations (if the layout parameter is a three-element array), or a 4-by-(ncols*nrows) array of grid positions with one position for each location in the ncols by nrows grid of locations (if the layout parameter is a two-element array). The return variable is suitable for passing to the POSITION keyword of an IDL graphics command (e.g., cgPlot, cgContour, cgImage, etc.). The grid positions are organized in row order, starting with the grid location in the upper-left of the graphihcs display window.
Parameters
- layout in required type=integer
This parameter sets up the grid layout for the current graphics window. A grid is organized by columns and rows, with the first grid position located in the upper-left corner of the current graphics display window and proceeding in row order. This parameter is either a two-element vector, giving the number of columns and number of rows, respectively (e.g., [ncols,nrows]), or it is a three-element vector, giving, in addition, the specific grid location for which a position is required (e.g, [ncols, nrows, gridPosition]). Grid positions start at 1 with the first grid in the upper left corner of the graphics display window and proceed in row order, sequentually, until the last grid position, which is equal to the number of columns times the number of rows.
Keywords
- ASPECT in optional type=float
This kewyord allows you to specify a specific aspect ratio for the return positions. The aspect ratio is calculated as YDimension/XDimension. So, for example, if you wish the positions to be twice as wide as they are high, you would set the Aspect keyword to 1.0/2.0 or 0.5. If you wish your positions to have a square aspect ratio, you would set the Aspect keyword to 1.0.
- IXMARGIN in optional type=integer
This keyword is a two-element vector that sets the right and left, respectively, inside X margin for the grid position. Units are multiples of !D.X_CH_SIZE. Default = [0,0].
- IYMARGIN in optional type=integer
This keyword is a two-element vector that sets the bottom and top, respectively, inside Y margin for the grid position. Units are multiples of !D.Y_CH_SIZE. Default = [0,0].
- OXMARGIN in optional type=integer
This keyword is a two-element vector that sets the right and left, respectively, inside X margin for the grid position. The default OXMargins are suitable for displaying line plots. If you are displaying image plots, you may wish to make the OXMargins the same on both sides of the graphics display window (e.g, OXMargin=[5,5]). Units are multiples of !D.X_CH_SIZE. Default = [10,4].
- OYMARGIN in optional type=integer
This keyword is a two-element vector that sets the bottom and top, respectively, inside Y margin for the grid position. The default OYMargins are suitable for displaying line plots. There is a little additional room at the top of the plot in the defaults for adding a title to a multiple plot set-up. Units are multiples of !D.Y_CH_SIZE. Default = [6,8].
- UNIT in optional type=float
The most difficult part of calculating a layout in a device-indepentent manner is coming up with a "unit" of measurement that makes sense. The current default unit is !D.X_PX_CM / 4.0. This gives respectable results for "normal" sized windows and a "normal" number of multiplots. It may not work for you. If not, feel free to set your own unit here. The margin and gap keywords are multiplied by this value before the layout is calculated.
- XGAP in optional type=integer default=14
This keywords sets the distance between plots in the X dimension. Units are multiples of !D.X_CH_SIZE.
- YGAP in optional type=integer default=8
This keywords sets the distance between plots in the Y dimension. Units are multiples of !D.Y_CH_SIZE.
Examples
Here is how to use this program to display line plots:
   cgDisplay, WID=0
   pos = cgLayout([2,2])
   FOR j=0,3 DO BEGIN
     cgPlot, cgDemoData(17), NoErase=j NE 0, Position=pos[*,j], Title='Plot ' + StrTrim(j+1,2)
   ENDFOR
   cgText, 0.5, 0.925, /Normal, 'Example Plot Layout', Alignment=0.5, Charsize=cgDefCharsize()*1.25
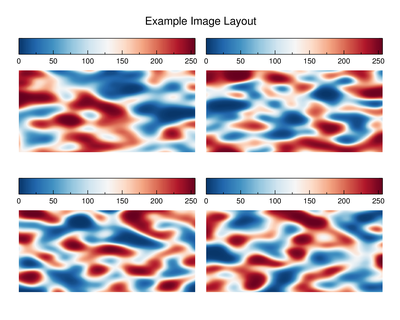
   cgDisplay, WID=1
   cgLoadCT, 22, /Brewer, /Reverse
   pos = cgLayout([2,2], OXMargin=[5,5], OYMargin=[5,12], XGap=3, YGap=10)
   FOR j=0,3 DO BEGIN
     p = pos[*,j]
     cgImage, cgDemoData(18), NoErase=j NE 0, Position=p
     cgColorBar, position=[p[0], p[3]+0.05, p[2], p[3]+0.1]
   ENDFOR
   cgText, 0.5, 0.925, /Normal, 'Example Image Layout', Alignment=0.5, Charsize=cgDefCharsize()*1.25
Here is how to display square plots in a PostScript file:
   cgPS_Open, 'cglayout_example.ps'
   cgDisplay
   pos = cgLayout([2,2], Aspect=1.0)
   FOR j=0,3 DO BEGIN
     cgPlot, cgDemoData(17), NoErase=j NE 0, Position=pos[*,j], Title='Plot ' + StrTrim(j+1,2)
   ENDFOR
   cgText, 0.5, 0.925, /Normal, 'Example Plot Layout', Alignment=0.5, Charsize=cgDefCharsize()*1.25
   cgPS_Close
   cgDisplay, 800, 600, WID=3
   cgPlot, cgDemoData(17), Position=cgLayout([3,2,3])
Author information
- Author:
FANNING SOFTWARE CONSULTING:
David W. Fanning 1645 Sheely Drive Fort Collins, CO 80526 USA Phone: 970-221-0438 E-mail: david@idlcoyote.com Coyote's Guide to IDL Programming: http://www.idlcoyote.com- Copyright:
Copyright (c) 2012-2014, Fanning Software Consulting, Inc.
- History:
Change History:
  Written, 19 December 2012 by David W. Fanning, from suggestions from Matthew Argall.
  Changed the notion of one "unit" from the values of !D.X_CH_SIZE and !D.Y_CH_SIZE to
      1/3 of the value of !D.X_PX_CM. This gives me more consistent measurements on the
      display and in a PostScript file. 12 Feb 2013. DWF.
  Modified the default unit to be !D.X_PX_CM/4.0 and added a UNIT keyword so users can
      choose a value that makes senses for their layouts. 25 Nov 2014. DWF.
  Added checks to be sure margin keywords contain two elements. 15 Dec 2014. DWF.
File attributes
| Modification date: | Fri Mar 27 11:07:35 2015 |
| Lines: | 354 |
| Docformat: | rst rst |