
Creating Titles on Multiple Plot Pages
QUESTION: I am using !P.Multi to set up six plots on my page in a three-column by two-row arrangement. I want to put a title on this page, but I can't figure out how to leave room for it. How can I do it?
![]()
ANSWER: The outside margins of a multiple-plot page are controlled by the ![XYZ].OMargin system variables. These system variables use that old favorite of mine, character units, as the unit of measure. The default value for the outside margin is always [0,0].
Try something like this:
   !X.OMargin = [2, 6]
   !Y.OMargin = [2, 6]
   !P.Multi = [0, 3, 2]
   FOR j=0, 5 DO cgPlot, cgDemoData(17)
   cgText, 0.5, 0.95, ALIGNMENT=0.5, CHARSIZE=1.25, /NORMAL, $
      'This is the plot title'
   !P.Multi = 0
   !Y.OMargin = [0, 0]
   !X.OMargin = [0, 0]
The results are shown in the figure below.
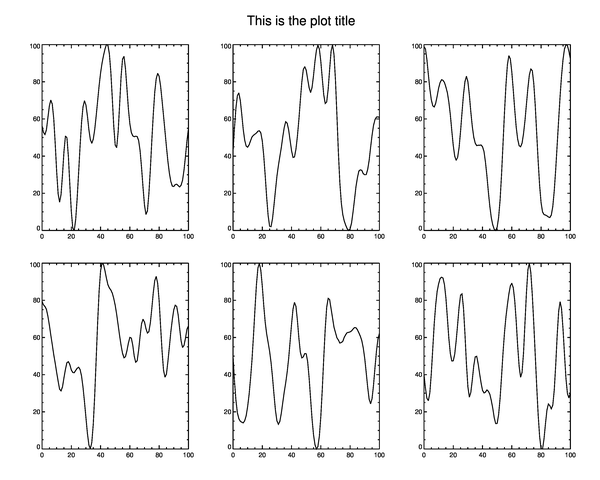 |
| Setting the outside margin of multi-plots. |
Note that the behavior of the outside margin system variables is slightly different when outputting to PostScript files. There, you must set the !P.Multi and !Y.OMargin system variables before each page of PostScript output. If you try to do multiple page PostScript output as in the example above, the outside margins will apply only to the first page of output.
![]()
Multiple Plots Using cgWindow
If you are performing multiple plots in cgWindow, you do not want to use !P.Multi or the outside margin system variables. Rather, you want to use the equivalent cgWindow keywords, like this.
   cgWindow, WXSize=900, WYSize=600, WMulti=[0,3,2], WOXMargin=[2,6], WOYMargin=[2,6]
   cgControl, Execute=0
   FOR j=0,5 DO cgPlot, cgDemoData(17), /AddCmd
   cgText, 0.5, 0.95, Alignment=0.5, /Normal, 'This is the Plot Title', /AddCmd
   cgControl, Execute=1
![]()
Updated Multiplot Routine
!P.Multi is wonderful for producing multiple plot or graphics on a page, but often it is much too confining. You may find you prefer to use cgLayout to set up your multiple plot page. With cgLayout you can not only control the outside margins of your multiple plot layout, but you can control the inside margins and aspect ratio of each individual plot in your multi-plot layout. You can also control the gap spacing between plots in both the X and Y directions.
cgLayout is perfect for setting up multiple plots, each of which is associated with a color bar or other plot annotation. For example, here is code that will display four image plots, each with its own color bar in a 2x2 grid multiple plot layout.
   cgDisplay, WID=1
   cgLoadCT, 22, /Brewer, /Reverse
   pos = cgLayout([2,2], OXMargin=[5,5], OYMargin=[5,12], XGap=3, YGap=10)
   FOR j=0,3 DO BEGIN
     p = pos[*,j]
     cgImage, cgDemoData(18), NoErase=j NE 0, Position=p
     cgColorBar, position=[p[0], p[3]+0.05, p[2], p[3]+0.1]
   ENDFOR
   cgText, 0.5, 0.925, /Normal, 'Example Image Layout', Alignment=0.5, $
      Charsize=cgDefCharsize()*1.25
You see the result in the figure below.
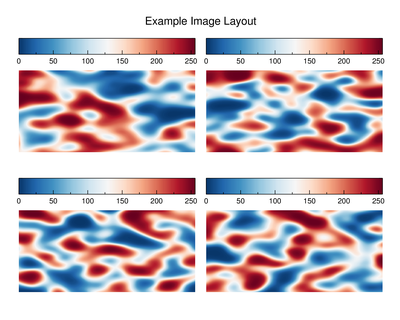 |
| Multiple plots with cgLayout. |
![]()
Written 28 January 1997
Updated 20 May 2013