
Creating Multiple IDL Plots


QUESTION: What is the best way to create multiple IDL plots on a page or in a graphics window?
![]()
ANSWER: There really is no “best ”way to create multiple plots. It depends entirely on what it is you are trying to do. The basic principle behind multiple plots is judicious use of of the Position and NoErase keywords with basic IDL graphics commands. This allows you to produce such plots as ladder plots, plots within other plots, or any kind of an asymmetric plot arrangement. For example, here is code to produce three plots on a page, where each plot is a different size.
   cgDisplay, 800, 550
   cgPlot, cgDemoData(17), Position=[0.10, 0.10, 0.45, 0.90]
   cgPlot, cgDemoData(17), Position=[0.55, 0.40, 0.95, 0.90], /NoErase
   cgPlot, cgDemoData(17), Position=[0.55, 0.10, 0.95, 0.30], /NoErase
You see the result in the figure below.
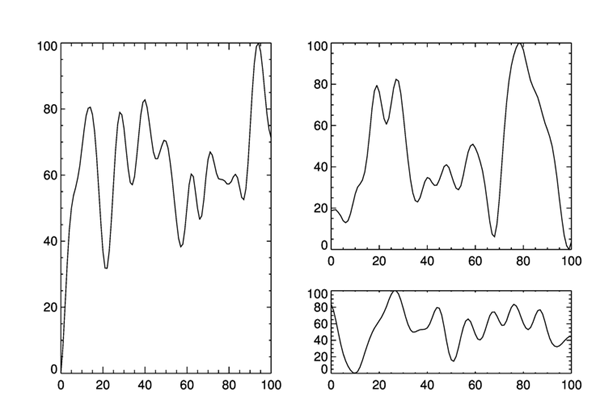 |
| An asymmetric multi-plot arrangement. |
When producing multiple plots yourself with the Position and NoErase keywords, you often have to pay attention to character size. Smaller character sizes are often used with multiple plots. One easy way to change the character size for all the plots at once is to set the !P.Charsize system variable to the size you want. Be sure to set it back to its default value when you are finished with your multiple plots.
![]()
Plots on a Grid
Another common arrangement of multiple plots is to position the plots on a grid of columns and rows. The traditional method of doing this is to use the !P.Multi system variable to create the grid for the plots. Here, for example, is how you can create a three column by two row arrangement of plots in a graphics window.
   cgDisplay, 900, 600
   !P.Multi = [0, 3, 2]
   FOR j=0,5 DO cgPlot, cgDemoData(17)
   !P.Multi = 0
You see the result in the figure below.
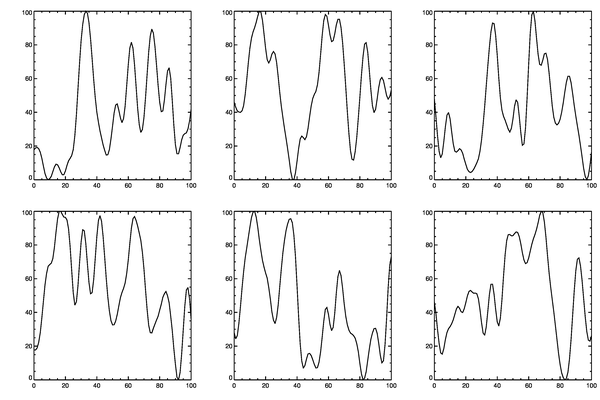 |
| Using !P.Multi to create a 3x2 grid of plots. |
The primary benefit of using !P.Multi is that you no longer have to worry about the Position and NoErase keywords. Nor do you have to worry about character size. All of these things are taken care of my !P.Multi itself. In fact, you want to studiously avoid using the Position and NoErase keywords in your code when you are using !P.Multi, or the results will leave you shaking your head in bewilderment at the final results!
It is often the case that you wish to leave room for a title, or maybe a color bar, in your multiple plot arrangement. (This arrangement also doesn't leave enough room, it seems to me, on the right-hand side of the plot.) To modify the grid, you may want to take advantage of the ability to control the outside margins of the plot grid.
   !Y.OMargin = [2, 8]
   !X.OMargin = [2, 6]
   cgDisplay, 900, 600
   !P.Multi = [0, 3, 2]
   FOR j=0,5 DO cgPlot, cgDemoData(17)
   cgText, 0.5, 0.95, Alignment=0.5, /Normal, 'This is the Plot Title'
   !P.Multi = 0
   !Y.OMargin = [0, 0]
   !X.OMargin = [0, 0]
You see the result in the figure below.
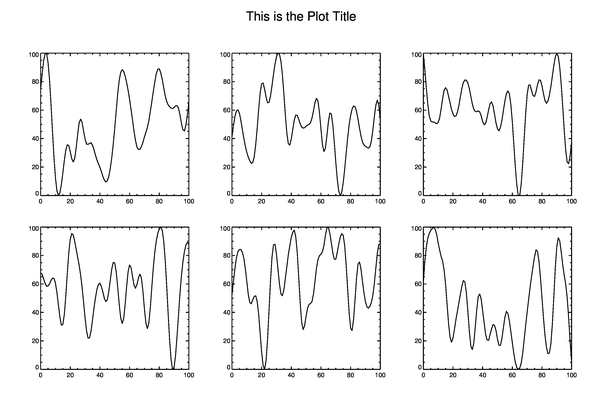 |
| Using !P.Multi with outside margins to create a 3x2 grid of plots. |
Note that if you want to create a multiple plot grid like this in the Coyote Graphics resizeable window, cgWindow, you do not use !P.Multi. Rather, you use the equivalent cgWindow keywords, which will cause cgWindow to set !P.Multi internally when the plots are drawn in the window.
   cgWindow, WXSize=900, WYSize=600, WMulti=[0,3,2], WOXMargin=[2,6], WOYMargin=[2,8]
   cgControl, Execute=0
   FOR j=0,5 DO cgPlot, cgDemoData(17), /AddCmd
   cgText, 0.5, 0.95, Alignment=0.5, /Normal, 'This is the Plot Title', /AddCmd
   cgControl, Execute=1
Combining Grids
As long as your plots are laid out in a grid, you can use !P.Multi to combine grids. The secret here is to use the first element of !P.Multi wisely. Remember, it is an indication of the number of plots remaining to be plotted in the window. Here, for example, is code to draw a large plot on the left-hand side of the page and three smaller plots on the right-hand side. Note how I have to manipulate the character size to get the plot I want. This is a consequence of the plot outside margins being calculated in units of character size.
   !Y.OMargin = [2, 8]
   !X.OMargin = [2, 6]
   !P.Charsize=0.60
   cgDisplay, 900, 600
   !P.Multi = [0, 2, 1]
   cgPlot, cgDemoData(17)
   !P.Charsize=1.25
   !P.Multi = [3, 2, 3, 0, 1]
   FOR j=0,2 DO cgPlot, cgDemoData(17)
   cgText, 0.5, 0.95, Alignment=0.5, /Normal, 'This is the Plot Title'
   !P.Multi = 0
   !P.Charsize = 0
   !Y.OMargin = [0, 0]
   !X.OMargin = [0, 0]
You see the result in the figure below.
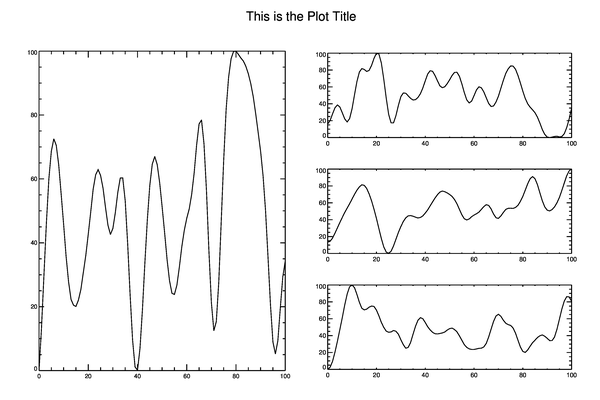 |
| Using !P.Multi to combine grids in a single plot. |
![]()
More Control Over Multiple Plot Grids
While !P.Multi is simple and easy to use (once you learn to count backwards), it doesn't always give you enough control over where your multiple plots are placed on the page. For example, if you wanted to put titles on your plots, or you wanted to display a colorbar over the top or off to the side of an individual plot, then !P.Multi seldom gives you enough room between multiple plots to do this. In these situations, I prefer to specify plot positions with the Coyote Library routine, cgLayout.
The cgLayout program calculates plot positions is a manner similar to !P.Multi, except that the user has total control over the outside margins and the gap spacing (both horizontally and vertical) between plots. This allows the user to "leave room" around plots for other plot annotations, such as titles and color bars. The program returns a plot position (or, more often, an array of plot positions) that can be used to locate the plot in the output window with the Position keyword. To draw multiple plots, you will again have to use both the Position and NoErase keywords.
Here, for example, is code to draw four images, each with its own color table.
   cgDisplay, 900, 750
   pos = cgLayout([2,2], OXMargin=[3, 3], OYMargin=[3, 14], XGap=5, YGap=12)
   cgLoadCT, 3, /Reverse, /Brewer, RGB_Table=palette
   cgImage, cgDemoData(18), Position=pos[*,0], Palette=palette, /Save
   cbpos = [!X.Window[0], !Y.Window[1]+0.05, !X.Window[1], !Y.Window[1]+0.10]
   cgColorbar, Palette=palette, Position=cbpos
   cgLoadCT, 5, /Reverse, /Brewer, RGB_Table=palette
   cgImage, cgDemoData(18), Position=pos[*,1], Palette=palette, /Save, /NoErase
   cbpos = [!X.Window[0], !Y.Window[1]+0.05, !X.Window[1], !Y.Window[1]+0.10]
   cgColorbar, Palette=palette, Position=cbpos
   cgLoadCT, 7, /Reverse, /Brewer, RGB_Table=palette
   cgImage, cgDemoData(18), Position=pos[*,2], Palette=palette, /Save, /NoErase
   cbpos = [!X.Window[0], !Y.Window[1]+0.05, !X.Window[1], !Y.Window[1]+0.10]
   cgColorbar, Palette=palette, Position=cbpos
   cgLoadCT, 9, /Reverse, /Brewer, RGB_Table=palette
   cgImage, cgDemoData(18), Position=pos[*,3], Palette=palette, /Save, /NoErase
   cbpos = [!X.Window[0], !Y.Window[1]+0.05, !X.Window[1], !Y.Window[1]+0.10]
   cgColorbar, Palette=palette, Position=cbpos
   cgText, 0.5, 0.95, Alignment=0.5, /Normal, 'This is the Plot Title', Charsize=1.75
You see the result in the figure below.
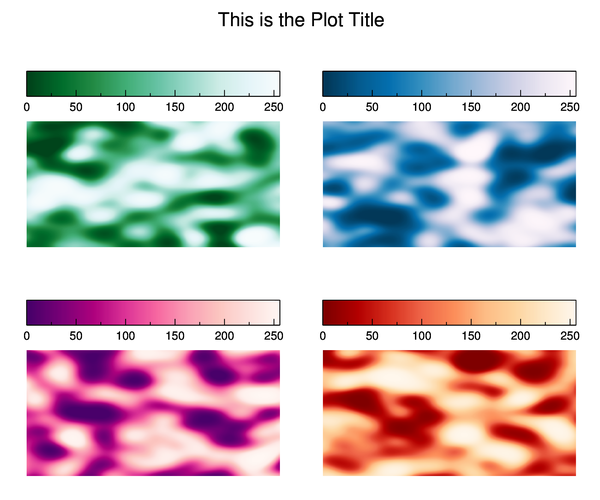 |
| Using cgLayout to create a plot grid with room for annotations. |
![]()
Version of IDL used to prepare this article: IDL 8.2.2.
![]()
![]()


