
Positioning IDL Graphics Plots
There are basically three ways to position graphics on the display. You can use a plot position, a plot region, or a plot margin. Normally, IDL calculates the plot margins for you and fills up the display window with the plot. This works great most of the time.
The problem, though, is with the way plot margins are calculated. Plot margins use character size as the unit of measure. This is not a particularly good unit as unit of measures go, because it varies with the character size you have selected for your plot. You can see the effect of character size on margins by typing the IDL commands below.
   IDL> data = DIST(31,31)
   IDL> CONTOUR, data
   IDL> CONTOUR, data, CHARSIZE=3.0
On most displays, the portion of the display devoted to the contour plot in the second CONTOUR command is very small, while the characters are very large.
To avoid this kind of problem, most of us, when we care about graphic positioning, use plot positions. This can be done with the !P.POSITION system variable, if you want to set the position of all your plots globally. Or, it can be done with the POSITION keyword to any of the graphics output commands (e.g., PLOT, SURFACE, MAP_SET, etc.). I prefer to use the POSITION keyword, because then I know what my code is doing when I read it and because I don't have to worry about what the system variable is set to and who set it. (This is especially true in widget programming.)
The POSITION keyword uses normalized coordinate units (i.e., units that go from 0 to 1 in in the current window) to map the axes of the plot to specific locations in the window. For example, suppose I want the left axes of my contour plot to be located 15% of the way across the display window, and the right axes to be located 85% of the way acrss the display window. I want the bottom of my plot to be located 20% of the way from the bottom of the window and the top of my plot to extend to within 5% of the top of the window. I would draw my contour plot like this:
IDL> CONTOUR, data, POSITION=[0.15, 0.20, 0.85, 0.95]
You can see that the general form of the POSITION keyword is this:
IDL> POSITION=[leftAxisLoc, bottomAxisLoc, rightAxesLoc, topAxesLoc]
Using the POSITION keyword, you can put graphics plots anywhere you like in the display window. (The same idea applies to PostScript output, too.) Note, that if you are putting graphics commands that normally erase the window before they are displayed (e.g., PLOT, CONTOUR, SURFACE, etc.) you will have to use the NOERASE keyword on the second and all subsequent plots that go into the same window.
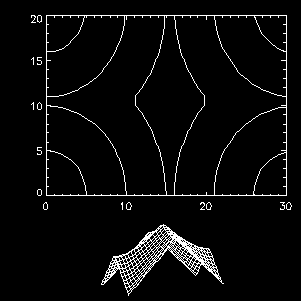
For example, you might be interested in helping your user understand the significance of a contour plot, so you display a larger contour plot of the data with a smaller surface plot of the data centered underneath the contour plot to aid in user orientation. Your code might look this:
   IDL> WINDOW, /FREE, XSIZE=300, YSIZE=300
   IDL> data = DIST(31,21)
   IDL> CONTOUR, data, POSITION=[0.15, 0.35, 0.95, 0.95]
   IDL> SURFACE, data, XSTYLE=4, YSTYLE=4, ZSTYLE=4, $
              POSITION=[0.35, 0.05, 0.75, 0.25], /NOERASE
Your output will look similar to the picture below.
Another way to put multiple plots on the page is to use the system variable !P.MULTI. See the Programming Tip "Overplotting Data on !P.MULTI Plots" which covers this and more.
Positioning images in a display window is done differently. To see an example of how to position an image in the window, see the Programming Tip "How do I Position Images on the display?"
![]()
Last Updated 2 December 1996