
Contouring with Out-of-Bounds Colors


QUESTION: I've just discovered the out-of-bounds color keywords on the cgColorbar command. These are really handy and I would like to use them. But I am having a very difficult time loading colors and getting them correct in the color bar with my filled contour plot. Can you show me how to set my colors and contour plot up to take advantage of these out-of-bounds colors?
![]()
ANSWER: Yes, this can be extremely difficult to get your head around. This is especially true because of the way the Contour command in IDL colors contour intervals. In fact, the Contour command does it differently if you use the FILL keyword, or if you use the CELL_FILL keyword. Rather than explain how the Contour command does this (which always gives me a headache to think about, and then I'm never sure I understand it anyway), I am going to just show you how I work around the problem and get identical results with both keywords by using the cgContour command.
Let's start with a data set we wish to contour. The data I am going to use has values from 0 to 1550. I want to contour the data from 100 to 1200. Any data value less than 100 will be out-of-bounds low, and any data value greater than 1200 will be out-of-bounds high. Here is how I am going to get started.
   data = cgDemoData(2)
   nlevels = 12
   oob_low = 0
   oob_high = nlevels
   levels = Indgen(nlevels)*100 + 100
   range = [Min(levels), Max(levels)]
The next step is to load the color table with the colors we want to display. This part is a little non-intuitive, but it has everything to do with the way the IDL Contour command works. Basically, what we are going to do is load the out-of-bounds low color in the 0 index of the color table, and load the out-of-bound high color in the nlevels index of the color table. The colors between these two indices can be whatever we want them to be. I will use colors from color table 33, a Blue-Red color table. We will use Hot Pink for the out-of-bounds low color and Tan for the out-of-bounds high color.
   cgLoadCT, 0 ; Start fresh
   TVLCT, cgColor('Hot Pink', /Triple), oob_low
   cgLoadCT, 33, NColors=nlevels-1, Bottom=1
   TVLCT, cgColor('Tan', /Triple), oob_high
If you like, you can view the color table with the CIndex command from the Coyote Library.
CIndex
Next, we create the filled contour plot. The trick here is how we must specify the the contour levels. To make this work, we have to make absolutely sure that the first contour level is the minimum value of the data set. Otherwise, nothing we do will make any sense at all and it will be impossible to get the out-of-bounds colors correct. Note in the command below how I do this.
This trick works in conjunction with how I will specify the contour color values. Note that I must use one more value than I have levels, and I must start these contour values at 0, where I have loaded my out-of-bounds low color.
   cgContour, data, Levels=[Min(data),levels], /Fill, C_Colors=Indgen(nlevels+1), $
     /Outline, Position=[0.1, 0.1, 0.9, 0.8]
Finally, I add the color bar to the plot. In this case the NColors and Bottom keywords are exactly the same as on the previous cgLoadCT command, and I use the out-of-bounds keyword to locate the out-of-bounds colors. Note the use of the Fix function to be sure the oob_high and oob_low values are integers and not long integers, which can be misinterpreted as colors.
   cgColorbar, NColors=nlevels-1, Bottom=1, OOB_High=Fix(oob_high), $
       OOB_Low=Fix(oob_Low), /Discrete, /Fit, Range=range
You see the result in the figure below.
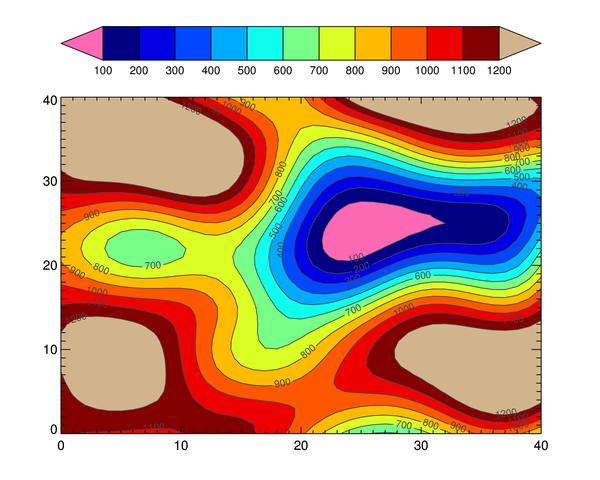 |
| A contour plot with out-of-bounds colors. |
![]()
QUESTION: This is all well and good, but I don't necessarily want my out-of-bounds colors to be completely different colors from the colors in the color table. I would like them to be extensions of the colors in the color table. How do I do that?
![]()
ANSWER: You do that by simply modifying the number of colors you load. Instead of loading nlevels-1 colors, starting at index 1, you load nlevels+1 colors, starting at index 0. The code looks like this.
  cgLoadCT, 33, NColors=nlevels+1, Bottom=0
  cgContour, data, Levels=[Min(data),levels], /Fill, C_Colors=Indgen(nlevels+1), $
     /Outline, Position=[0.1, 0.1, 0.9, 0.8]
  cgColorbar, NColors=nlevels-1, Bottom=1, OOB_High=Fix(oob_high), $
       OOB_Low=Fix(oob_Low), /Discrete, /Fit, Range=range
You see the result in the figure below.
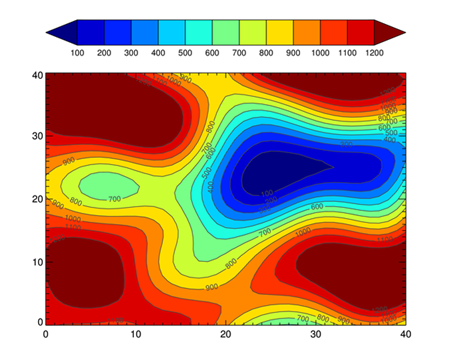 |
| A contour plot with out-of-bounds colors as extensions of the color table.. |
![]()
Version of IDL used to prepare this article: IDL 7.1.2.
![]()
![]()


