
The Confidence Interval of the Correlation Coefficient


QUESTION: How can I calculate the 95% confidence interval of a correlation coefficient between two variables?
![]()
ANSWER: It appears from a quick search of the Internet that the best way to do this is to use a Fisher Z Transformation to convert the distribution of the correlation coefficient into a normalized distribution from which a confidence level can be determined. The IDL code I will show you came from a snippet of SAS code found in this reasonably lucid account of the process by Shen and Lu. I had a bit of trouble (since I am no statistician) with one step in their process (picking the critical value of a 95 percent confidence limit), but I got some help with this in this article by David Lane, and in this more visual diagram.
Let's start by plotting some data and obtaining the correlation coefficient, rho.
   n = 101
   x = cgDemoData(1)+ RandomU(-3L, n) * 10
   y = cgDemoData(1)+ RandomU(-5L, n) * 10
   cgScatter2D, x, y, Coefficient=rho
A plot of the data is shown here.
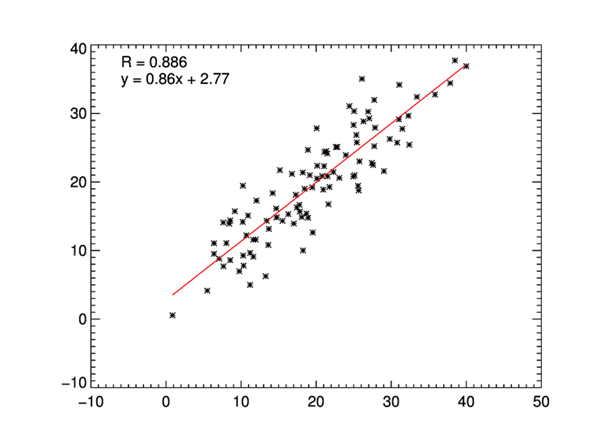 |
| The scatter plot of the data with the correlation coefficient. |
There are other wayy to calculate the correlation coefficient. For example, we could have done this.
rho = Correlate(x, y)
However you get it, you need to apply the Fisher Z Transformation to it. The code, taken from the Shen and Lu paper, looks like this. The number 1.96 comes from a table of critical values for normalized distributions. The value for a 99 percent confidence level would be 2.58. The latter, of course, would result in a wider confidence interval.
    fisherTransform = 0.5D * (Alog(1+rho) - Alog(1-rho))
    sigmaz = 1.0D / Sqrt(n-3)
    l_95 = fisherTransform - (1.96D * sigmaz)
    h_95 = fisherTransform + (1.96D * sigmaz)

    lo95 = (Exp(2*l_95)-1)/(Exp(2*l_95)+1)
    hi95 = (Exp(2*h_95)-1)/(Exp(2*h_95)+1)
    Print, '95% Confidence Interval:  ', [lo95, hi95]
The results looked like this.
95% Confidence Interval: 0.83528709 0.92187240
For a sanity check to be sure I coded this correctly, I used another page from my Google search to find a confidence level calculator. I plugged my numbers in and they matched.
Ken Bowman has provided IDL users on the IDL newsgroup with a program to find confidence intervals for other statistical values. The program is named Regression_Statistics_KPB
Here is an example of how the program can be used and its output.
stats = Regression_Statistics_KPB(x, y, CI=95, /Verbose)
The output from the program (which is also returned in the variable stats) looks like this. You see that it provides confidence levels for both the slope and the intercept of the correlation line.
   Intercept (a)             :       2.77016
   Slope (b)                 :      0.858863
   Correlation coefficient r :      0.886077
   r^2                       :      0.785133
   F-statistic               :       361.750
   Chi-square statistic      :       1373.92
   n                         :           101
   Mean of x                 :       19.5523
   Mean of y                 :       19.5629
   S.D. of residuals         :       3.72532
   S_xx                      :       6805.92
   S_yy                      :       6394.28
   S_xy                      :       5845.35
   S.E. of a                 :      0.957571
   S.E. of b                 :      0.045156
   Confidence limit          :      95%
   Level for t-test          :      0.025000000
   t-statistic               :      1.9842176
   Confidence interval for a :      2.77016+/-1.9000288     [ 0.87013186, 4.67018950]
   Confidence interval for b :      0.858863+/-0.089600280  [ 0.76926272, 0.94846328]
![]()
Version of IDL used to prepare this article: IDL 8.2.3.
![]()
![]()


