
Interpolating Flux to Regular Wavelengths
QUESTION: I have my data in two columns. The first column is the wavelength in angstroms and the second column is the flux. The data looks like this.
     wavelength          flux
    5201.720215        0.0097
    5205.345215        0.0088
    5208.970703        0.0080
    5212.596191        0.0094
    5216.221680        0.0133
    5219.846680        0.0167
    5223.472168        0.0169
    5227.097656        0.0156
    5230.722656        0.0145
    5234.348145        0.0138
    5237.973633        0.0130
    5241.599121        0.0118
    5245.224121        0.0110
    5248.849609        0.0116
    5252.475098        0.0134
    5256.100586        0.0147
    5259.725586        0.0139
    5263.351074        0.0126
I want to create a new data set from this data that is sampled or re-binned on 1 angstrom intervals, with the flux linearly interpolated from the data I have collected. I am confused about which routines in IDL I should use (Rebin, Congrid, Interpolate, etc.) to do this. Can you show me how this can be done?
![]()
ANSWER: Today's answer is provided by Wox on the IDL newsgroup.
Since your data is already ordered in a monotonically increasing way and is the same data type, we can just create a two-dimensional array of the data.
   data = [ [5201.720215d, 0.0097],$
            [5205.345215d, 0.0088],$
            [5208.970703d, 0.0080],$
            [5212.596191d, 0.0094],$
            [5216.221680d, 0.0133],$
            [5219.846680d, 0.0167],$
            [5223.472168d, 0.0169],$
            [5227.097656d, 0.0156],$
            [5230.722656d, 0.0145],$
            [5234.348145d, 0.0138],$
            [5237.973633d, 0.0130],$
            [5241.599121d, 0.0118],$
            [5245.224121d, 0.0110],$
            [5248.849609d, 0.0116],$
            [5252.475098d, 0.0134],$
            [5256.100586d, 0.0147],$
            [5259.725586d, 0.0139],$
            [5263.351074d, 0.0126] ]
Next, we need to create a vector representing the wavelengths that we want to include in the new data set. In this case, we need a vector going from 5201 to 5264 angstroms.
   start_wl = Floor(Min(data[0,*]))
   end_wl = Ceil(Max(data[0,*]))
   wl_vector = cgScaleVector(Findgen(end_wl-start_wl+1), start_wl, end_wl)
Next, we simply linearly interpolate the flux at the locations given by this new wavelength vector. We use the Interpol command in IDL to do this.
interp_flux = Interpol(data[1,*], data[0,*], wl_vector)
We can plot the data to see how we have done. The original data is drawn with a blue line. The newly interpolated flux data is overplotted in red symbols. The original data points are overplotted in green symbols.
   cgPlot, data[0,*], data[1,*], Color='dodger blue', XStyle=1, Thick=2, /Window
   cgPlot, wl_vector, interp_flux, Color='red', PSym=16, /Overplot, /Add
   cgPlot, data[0,*], data[1,*], SymColor='light sea green', PSym=17, SymSize=2, /Overplot, /Add
You see the results in the figure below.
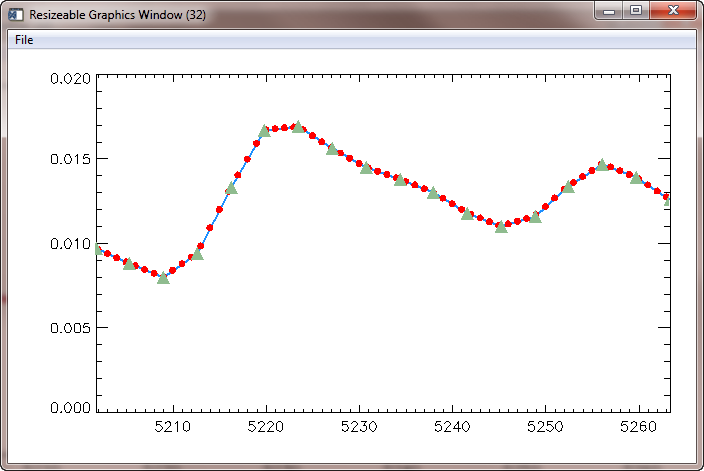 |
| The original and interpolated flux values. |
![]()
Version of IDL used to prepare this article: IDL 8.1.
![]()
![]()


