
Calculating Data Percentiles


QUESTION: Can you show me how to calculate data percentiles in IDL?
![]()
ANSWER: Calculating data percentiles is very easy. All you need is an ordered data set and the ability to count. To find the 75th percentile of the data, you simply find the value which separates the data into 75 percent falling below the value and 25 percent falling above the value.
All this is done for you in the Coyote Library routine, cgPercentiles. See the on-line documentation for additonal details.
Data percentiles are often used, for example, in calculating the values for box and whisker plots.
   IDL> data = RandomU(-3L, 5000) * 400
   IDL> Print, cgPercentiles(data, Percentiles=[0.25, 0.50, 0.75])
        104.850      199.899      299.465
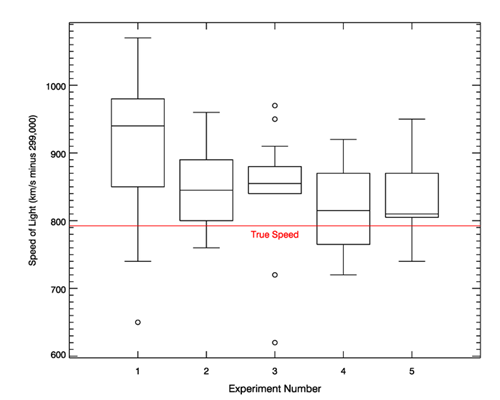 |
| Data percentiles are often used to construct box and whisker plots. |
![]()
Version of IDL used to prepare this article: IDL 8.2.2.
![]()
![]()
Copyright ©
1996–2018 Fanning Software Consulting, Inc.
Written: 4 June 2013


