
Creating Anisotropy Pie Plots
QUESTION: I have an eight sector detector which records electron intensities. I would like to plot the anisotropy in the various sectors in a pie chart of the sort shown in the figure below. Is this possible to do in IDL?
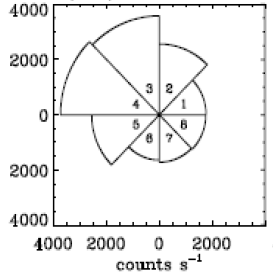 |
| This is an example of an anisotropic pie plot. |
![]()
ANSWER: Yes, this is possible. We will need a couple of helper programs to write the program. First, we will need a program that will allow us to draw the arc of a circle. We can just do a quick modification of a circle drawing program in IDL. Let's call the new program, Arc.
   FUNCTION Arc, xcenter, ycenter, radius, angle1, angle2
      IF N_Elements(angle1) EQ 0 THEN angle1 = 0.0
      IF N_Elements(angle2) EQ 0 THEN angle2 = 360.0
      points = (2 * !DPI  * !RaDeg / 999.0) * Findgen(1000)
      indices = Where((points GE angle1) AND (points LE angle2), count)
      IF count GT 0 THEN points = points[indices]
      x = xcenter + radius * COS(points * !DtoR )
      y = ycenter + radius * SIN(points * !DtoR)
      RETURN, Transpose([[x],[y]])
   END
Next, we will need a function to make sure the labels of the plot are always positive values. We will use this function with the YTickFormat and XTickFormat keywords to the plot command to label our plot axes correctly. Let's call this function PositiveLabel.
   FUNCTION PositiveLabel, axis, index, value
      IF value LT 0 THEN value = Abs(value)
      RETURN, String(value,FORMAT='(I0)')
   END
The pie chart is now easily drawn. Let's call the program Anisotropy_Plot. We will expect a vector of eight values that will represent the radii of the eight sectors of the plot. If the radii are not passed into the program, we will create a random sampling for demonstation purposes. The code will look like this.
   PRO ANISOTROPY_PLOT, radii

   Compile_Opt idl2

   On_Error, 2

   ; Need data?
   IF N_Elements(radii) EQ 0 THEN BEGIN
      radii = cgScaleVector(RandomU(-3L,8), 500, 1800)
   ENDIF

   ; Must have 8 radii.
   IF N_Elements(radii) NE 8 THEN Message, 'There must be 8 radii provided.'

   ; Wrap radii around onto itself.
   radii = [radii,radii[0]]
Next, we set up the sector angles and determine the maximum radius for the plot. We allow some extra room on the plot by adding 10 percent to the maximum radius.
  ; Set up angles.
  angle = Dindgen(9) * 45

  ; Determine the maximum radius. Leave some extra room.
  maxRadius = Max(Abs(radii))
  maxRadius = Long(maxRadius + 0.1*maxRadius)
Now, we draw the plot without data. Note that we preserve the square aspect ration of the plot to prevent our circles from becoming ellipses.
   cgPlot, [-maxRadius, maxRadius],[-maxRadius, maxRadius], /NoData, $
       ASPECT=1.0, XTICKFORMAT='PositiveLabel', YTICKFORMAT='PositiveLabel', $
       XTITLE='Counts s!U-1!N'
Now, we simply draw and label the eight sectors in a loops. All line drawing is done with cgPlotS.
   FOR j=0,7 DO BEGIN

      ; Draw the sides of the pie wedge.
      xr = [ 0, radii[j]*Cos(angle[j]*!DtoR) ]
      yr = [ 0, radii[j]*Sin(angle[j]*!DtoR) ]
      cgPlotS, xr, yr, COLOR='navy', THICK=2
      xr = [ 0, radii[j]*Cos(angle[j+1]*!DtoR) ]
      yr = [ 0, radii[j]*Sin(angle[j+1]*!DtoR) ]
      cgPlotS, xr, yr, COLOR='navy', THICK=2

      ; Draw the arc of the pie wedge.
      pts = Arc(0, 0, radii[j], angle[j], angle[j+1])
      cgPlots, pts, Color='navy', THICK=2

      ; Label the sector.
      textAngle = angle[j]+22.5
      textRadius = 0.2*maxRadius
      xy = CV_COORD(FROM_POLAR=[textAngle, textRadius], /TO_RECT, /DEGREES)
      cgText, xy[0], xy[1], String(j+1, FORMAT='(I0)'), COLOR='red', ALIGNMENT=0.5
   ENDFOR
   END
Running the program results in the Figure shown below.
IDL> Anisotropy_Plot
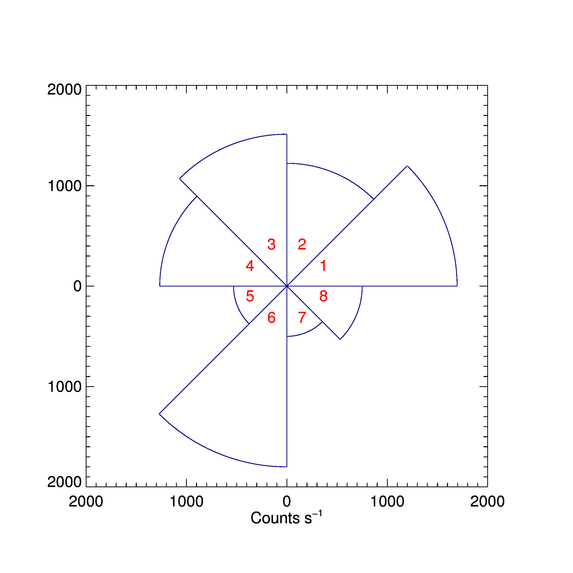 |
| The anisotropic pie plot created in IDL. |
![]()
Version of IDL used to prepare this article: IDL 7.0.1.
![]()
![]()


