.\
cgtaylordiagram.pro
includes main-level programtop cgTaylorDiagram
Graphics
cgTaylorDiagram, stddev, correlation [, /ADDCMD] [, C_CORRELATION=string] [, C_STDDEV=string] [, C_REF=string] [, C_SYMBOL=string] [, LABELS=string] [, /NOERASE] [, OUTPUT=string] [, /OVERPLOT] [, POSITION=float] [, REF_STDDEV=float] [, /RMS_CIRCLES_OFF] [, RMS_FORMAT=string] [, RMS_INCREMENT=float] [, /RMS_LABELS_OFF] [, STDDEV_MAX=float] [, SYMBOL=integer] [, SYMSIZE=float] [, /WINDOW]
The program implements a Taylor Diagram in IDL direct graphics. Addtional information can be found in this article.
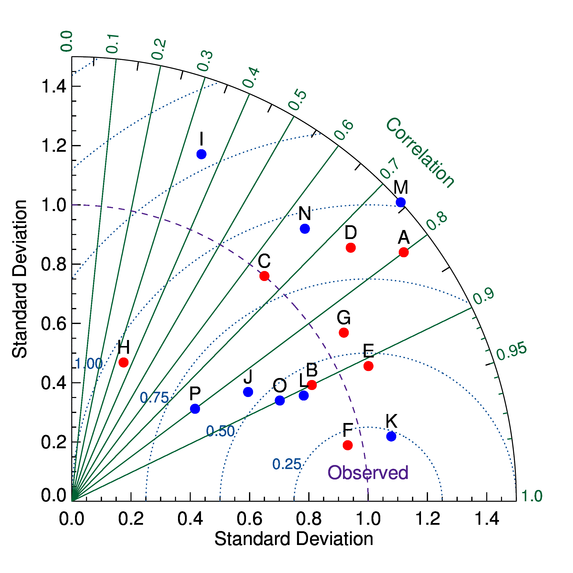
From the 2001 IPCC Reoprt:
     "Taylor diagrams provide a way of graphically summarizing how closely
     a pattern (or a set of patterns) matches observations.  The similarity between two
     patterns is quantified in terms of their correlation, their centered root-mean-square
     difference and the amplitude of their variations (represented by their standard
     deviations).  These diagrams are especially useful in evaluating multiple aspects of
     complex models or in gauging the relative skill of many different models."

     "In general, the Taylor diagram characterizes the statistical relationship between two
     fields, a "test" field (often representing a field simulated by a model) and a
     "reference" field (usually representing “truth”, based on observations)."

     "The two-dimensional space of the Taylor diagram can represent three different statistics
     simultaneously:
  - The centered RMS difference,
  - The correlation,
  - The standard deviation
Here is a simple, but complete, explanation of the diagram.
Parameters
- stddev in required type=float
An array of standard deviations for the points that will be plotted on the diagram. This array must be the same length as the
correlationarray and theLabelsarray, if it is used.- correlation in required type=float
An array of correlation coefficients for the points that will be plotted on the diagram. This array must be the same length as the
stddevarray and theLabelsarray, if it is used.
Keywords
- ADDCMD in optional type=boolean default=0
Set this keyword to add the command to the resizeable graphics window cgWindow.
- C_CORRELATION in optional type=string default=grn7
The name of the color used for the correlation lines on the diagram.
- C_STDDEV in optional type=string default=blu7
The name of the color used for the standard deviation lines on the diagram.
- C_REF in optional type=string default=pur7
The name of the color used for the observed reference line on the diagram.
- C_SYMBOL in optional type=string default=red
The name of the color used for the point symbols on the diagram.
- LABELS in optional type=string
An array of string labels for the points that will be plotted on the diagram. This array must be the same length as the
stddevarray and thecorrelationarray.- NOERASE in optional type=boolean default=0
Set this keyword if you don't want the Taylor Diagram plot to erase what is already on the display.
- OUTPUT in optional type=string
The name of an output file to write the Taylor Diagram to. The type of file is taken from the file extension. For example, OUTPUT='mydiagram.png'. It is assumed that Ghostscript and ImageMagick have been installed properly for all raster file output. If the Output keyword is used, nothing is drawn on the display. This keyword cannot be used with the Overplot keyword.
- OVERPLOT in optional type=boolean default=0
Set this keyword to overplot onto an already existing Taylor Diagram. Many keywords are ignored if this keyword is set. Only the data is drawn. The Output keyword cannot be used if overplotting.
- POSITION in optional type=float
A four-element, normalized array giving the position of the plot in the display window: [x0,y0,x1,y1].
- REF_STDDEV in optional type=float default=1.0
The reference standard deviation. This is typically the "observed" or "model" value. A scalar.
- RMS_CIRCLES_OFF in optional type=boolean default=0
Set this keyword to prevent the drawing of the RMS circles that radiate out from the observed RMS value.
- RMS_FORMAT in optional type=string default=(I0)
Set this keyword to a format string that is used for format the RMS circle labels.
- RMS_INCREMENT in optional type=float default=1.0
The RMS circles are drawn from the observed RMS value, using this value as an increment of the circle radius.
- RMS_LABELS_OFF in optional type=boolean default=0
Set this keyword to prevent the drawing of the RMS circle labels. If this keyword is set, only the RMS circles are drawn.
- STDDEV_MAX in optional type=float
The maximum standard deviation to plot on the graph.
- SYMBOL in optional type=integer default=16
The symbol used for the data points on the diagram. Any symbol supported by
cgSymCat.- SYMSIZE in optional type=float default=1.5
The size of the symbol used for the data points on the diagram.
- WINDOW in optional type=boolean default=0
Set this keyword to replace all the commands in a current cgWindow or to create a new cgWindow for displaying this command.
Examples
Here is how to use this program:
 labels = ['A', 'B', 'C', 'D', 'E', 'F', 'G', 'H']            ; Point labels.
 stddev = [1.4, 0.9, 1.0, 1.272, 1.1, 0.95, 1.08, 0.5]        ; Standard Deviations
 correlation = [0.8, 0.9, 0.65, 0.74, 0.91, 0.98, 0.85, 0.35] ; Correlations
 ref_std = 1.0                                                ; Reference standard (observed)
 stddev_max = 1.5                                             ; Standard Deviation maximum
 cgTaylorDiagram, stddev, correlation, REF_STDDEV=ref_std, STDDEV_MAX=stddev_max, LABELS=labels
Author information
- Author:
FANNING SOFTWARE CONSULTING:
David W. Fanning 1645 Sheely Drive Fort Collins, CO 80526 USA Phone: 970-221-0438 E-mail: david@idlcoyote.com Coyote's Guide to IDL Programming: http://www.idlcoyote.com- Copyright:
Copyright (c) 2013, Fanning Software Consulting, Inc.
- History:
Change History:
  Written, 10 January 2013 by David W. Fanning from a program by Fernando Santoro of
      ExelisVis that I found in the IDL Code Repository on the ExelisVis web page.
      Fernando did *all* of the hard work writing the program for the IDL 8 function
      graphics routine. I simply copied most of his code and adapted it for non-IDL 8
      users. I also added a couple of features I though were missing from the original code.
  Added OVERPLOT keyword. 21 May 2013. DWF.
  Added RMS_*** keywords to allow more control over the drawing and labeling of the RMS circles
      on the plot. 29 July 2013. DWF.
  Modified the algorithm that places the "Correlation" label to allow multiple plots in a
     window. Also removed a cgPolyFill command that appeared to have no effect. 19 Nov 2013. DWF.
  Added NOERASE keyword and made sure no window was opened when OUTPUT keyword is used. 21 Nov 2013. DWF.
  Added check to not create initial plot if PostScript is the current device. 18 Feb 2015. DWF.
  Small modification to prevent extraneous drawing on right edge of plot in PostScript files,
     and updated figures and documentation. 10 April 2015. DWF.
File attributes
| Modification date: | Fri Apr 10 11:24:05 2015 |
| Lines: | 635 |
| Docformat: | rst rst |