
Find Boundary Around ROI in Image
QUESTION: I've identified a region of interest in an image, but I would like to draw a boundary around the ROI so I can measure the perimeter. Can you show me how to do this?
![]()
ANSWER: You can use the Contour command to draw a boundary around a region of interest, but the output keywords are complicated to use. Also, the perimeter from the Contour command is difficult to calculate correctly, since the contour perimeter points are not contiguous, but are represented in vector form. (You could also use the IsoContour command, if you prefer to use the contouring algorithm used by the object graphics system.)
For all these reasons, I prefer to use a small program I wrote named Find_Boundary. This program, based on a chain-code algorithm first implemented in IDL code and given to me by Guy Blanchard, finds the boundary of a region of interest and, if requested, can calculate the perimeter length of the boundary and the area of the region of interest. It operates by following the boundary around in a counter-clockwise fashion, pixel by pixel, until it returns to the starting pixel.
The region of interest is specified as a vector of indices. Indices can be obtained in various ways. For example, you could use the Label_Region and Where functions to obtain indices of regions of interest. You might even draw a region of interest with a free-hand drawing tool (for example, with XROI), and use PolyFillV to obtain indices from the polygon points returned from the drawing tool. (See Masking Image Regions with XROI for details.)
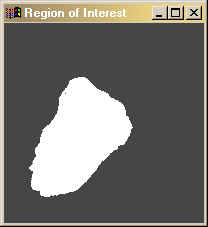
For example, here is a region of interest obtained from some work I have been doing recently for a client.
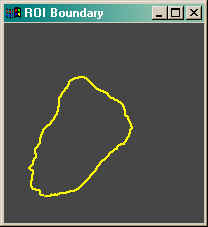
I can plot the boundary of this region of interest, as well as print the perimeter length and are enclosed by the boundary points with these commands:
   IDL> snapshot = TVRD()
   IDL> indices =  Where(snapshot GT 0)
   IDL> PlotS, Find_Boundary(indices, XSize=200, YSize=200, Perimeter=length, Area=area), /Device
   IDL> Print, 'Length: ', length, '     Area: ', area
        Length:       370.375     Area:       7313.00
Here is the result.
In the example for my client, the region of interest came from a microscope image, in which the scale in the X direction was different from the scale in the Y direction. At 4X power, the scale factors were [2.542, 2.364] millimeters per pixel. I can put the length in these units by using the Scale keyword:
   IDL> pts = Find_Boundary(indices, XSize=200, YSize=200, Perimeter=length, Area=area, Scale=[2.542, 2.364])
   IDL> Print, 'Length: ', length, '     Area: ', area
        Length:       906.745     Area:       43945.9
Note that the perimeter and area values returned from Find_Boundary are slightly different from the perimeter and area values found by the IDLanROI object, for example. As with contouring in general, there are numerous "right" answers. You should test any algorithm you choose to use on sample data that you are sure you understand. The approach used here is a pixel-by-pixel approach. It has the huge advantage, in my opinion, that I can see and understand the code. That gives me confidence. :-)
The Find_Boundary program has been incorporated into the larger Blob_Analyzer program to make ROI or blob analysis even easier.
![]()
Copyright © 2003 David W. Fanning
Last Updated 3 December 2003