
Transparent Polygon Shapes from Shapefiles


QUESTION: I have a shapefile containing Colorado counties. I wish to display only a single county, Summit County, on a map. I opened the file with cgShapeInfo and it looks to me like the values in the shapefile are not even in latitude and longitude! How in the world can I display this?
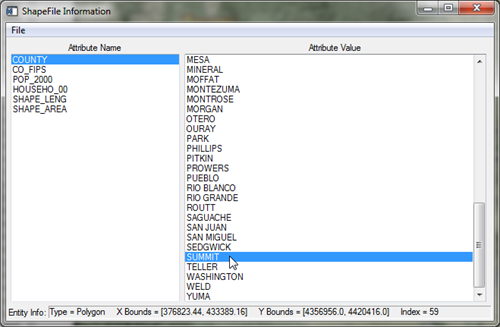 |
| Colorado county shapefile as viewed with cgShapeInfo. |
![]()
ANSWER: You are right, the values in the shapefile are in projected meter space, rather than latitude/longitude space. This means you are going to have to know something about the map projection used to create the shapefile in order to correctly display the shape polygons on a map of your choosing.
A "shapefile" is actually a collection of different files, containing various kinds of information. Sometimes there is a "projection" file (with a *.prj file extension) containing the information you need, and sometimes this information is included in an XML file (with a *.xml file extension) that is included with the shapefile collection. In your case, you have an projection file containing the information you are looking for. Here is its contents.
   PROJCS["NAD_1983_UTM_Zone_13N",GEOGCS["GCS_North_American_1983",
   DATUM["D_North_American_1983",SPHEROID["GRS_1980",6378137.0,298.257222101]],
   PRIMEM["Greenwich",0.0],UNIT["Degree",0.0174532925199433]],
   PROJECTION["Transverse_Mercator"],PARAMETER["False_Easting",500000.0],
   PARAMETER["False_Northing",0.0],PARAMETER["Central_Meridian",105.0],
   PARAMETER["Scale_Factor",0.9996],PARAMETER["Latitude_Of_Origin",0.0],UNIT["Meter",1.0]]
You want to pay attention the DATUM and PROJECTION information in this file. Here we see that the spheroid (IDL calls this the "ellipsoid") used for the datum is the GRS 1980 ellipsoid. The projection is a Transverse Mercator projection with a number of parameters. If you like, you can use all of this information to set up the map coordinate object. Note, however, that the "Central Meridian", which we are going to call the "Center Longitude", is incorrectly written in the file. It should be -105 to put the shape file in Colorado. This kind of error is not uncommon in shapefiles, so you have to be on your toes.
   mapCoord = Obj_New('cgMap', 'Transverse Mercator', ELLIPSOID='GRS 1980', $
     FALSE_EASTING=500000.0D, FALSE_NORTHING=0.0D, CENTER_LONGITUDE=-105)
The center longitude error probably persists in the file because no one uses it. It is much easier to recognize this map projection as a UTM projection that is in zone 13N. Almost everyone will set this projection up like this. Note here you do not need the False Easting and False Northing values, since this is assumed for a UTM projection. Nor do you need to specify the center longitude, since this is set by the UTM zone information.
utmMap = Obj_New('cgMap', 'UTM', ELLIPSOID='GRS 1980', ZONE=13)
We will leave this now, and come back to it when we extract and draw the shape of Summit County on the map. Now, let's turn our attention to the map itself. You can, of course, use any of IDL's mapping routines to draw your own map. But, since this is Summit County Colorado, after all, let's use a terrain map from Google. We can get the map image from Google with these commands. First, let's set up some variables we might want to change.
    centerLat = 39.5
    centerLon = -106.0
    zoom = 9
    scale = cgGoogle_MetersPerPixel(zoom)
    xsize = 600 < 640 ; Max size of Google image with this Google API
    ysize = 600 < 640 ; Max size of Google image with this Google API
    resolution = StrTrim(xsize,2) + 'x' + StrTrim(ysize,2)
We obtain the Google map image with these commands.
    googleStr = "http://maps.googleapis.com/maps/api/staticmap?" + $
        "center=" + StrTrim(centerLat,2) + ',' + StrTrim(centerLon,2) + $
        "&zoom=" + StrTrim(zoom,2) + "&size=" + resolution + $
        "&maptype=terrain&sensor=false&format=png32"
    netObject = Obj_New('IDLnetURL')
    void = netObject -> Get(URL=googleStr, FILENAME="googlemapimg.png")
    Obj_Destroy, netObject
    googleMapImage = Read_Image('googlemapimg.png')
The next step is to set up a map coordinate object for this Google map image. Google maps use a Mercator projection with a WGS 84 datum or ellipsoid. We create the map projection and set the ranges for the map itself, with these commands.
    googleMap = Obj_New('cgMap', 'Mercator', ELLIPSOID='WGS 84')
    uv = googleMap -> Forward(centerLon, centerLat)
    uv_xcenter = uv[0,0]
    uv_ycenter = uv[1,0]
    xrange = [uv_xcenter - (xsize/2.0D*scale), uv_xcenter + (xsize/2.0D*scale)]
    yrange = [uv_ycenter - (ysize/2.0D*scale), uv_ycenter + (ysize/2.0D*scale)]
    googleMap -> SetProperty, XRANGE=xrange, YRANGE=yrange
If you just want to display the outline of Summit Country on the map, you can simply use cgDrawShapes to select the proper polygon from the shapefile and draw it. The code looks like this. Note that cgDrawShapes requires you to pass in both the map coordinate object that describes the shapefile projection and the map coordinate object that describes the map the shape is being drawn onto. This is essential for locating the shape at the proper location on the map.
  cgDisplay, 700, 700, Aspect=googleMapImage
  cgImage, googleMapImage[0:2,*,*], Position=[0.1, 0.1, 0.9, 0.9], $
     /Keep_Aspect, OPosition=outputPosition
  googleMap -> SetProperty, POSITION=outputPostion
  shapefile = 'counties.shp'
  cgDrawShapes, shapefile, MapCoord=utmMap, DrawMapCoord=googleMap, $
      ATTRName='COUNTY', ATTRValue='SUMMIT', $
     /Projected_XY, Color='red', Thick=4
  cgMap_Grid, Map=googleMap, /Box_Axes, /cgGRID, Format='(F0.2)'
You see the result in the figure below.
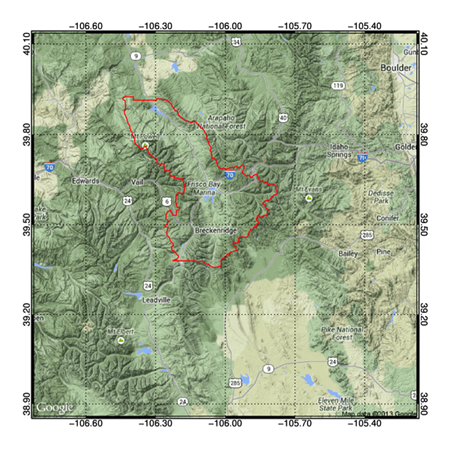 |
| The Summit County shape drawn as an outline on a Google map. |
But, you asked to see this as a transparent polygon. That is a little more difficult, especially because we want to be able to create high resolution PostScript files, too. Let's assume we have defined this program with a procedure definition statment and PostScript keyword like this.
PRO PolyShapeOnMap, PS=ps
Then, we could replace the code above with this code.
  cgDisplay, 700, 700, Aspect=googleMapImage, /Free, Pixmap=Keyword_Set(ps)
  cgImage, googleMapImage[0:2,*,*], Position=[0.1, 0.1, 0.9, 0.9], $
     /Keep_Aspect, OPosition=outputPosition
  googleMap -> SetProperty, POSITION=outputPostion
  shapefile = 'counties.shp'
  backgroundImage = cgSnapshot()

  shapefile = 'counties.shp'
  cgDrawShapes, shapefile, MapCoord=utmMap, DrawMapCoord=googleMap, $
      ATTRName='COUNTY', ATTRValue='SUMMIT', $
     /Projected_XY, Color='red', Thick=4
  cgDrawShapes, shapefile, MapCoord=utmMap, DrawMapCoord=googleMap, $
     ATTRName='COUNTY', ATTRValue='SUMMIT', $
     /Projected_XY, /Fill, FColor='orange'
  foregroundImage = cgSnapshot()

  IF Keyword_Set(ps) THEN cgPS_Open, 'summit.ps'
  cgBlendImage, foregroundImage, backgroundImage, Alpha=0.3, $
     Position=[0.0, 0.0, 1.0, 1.0]
  cgMap_Grid, Map=googleMap, /Box_Axes, /cgGrid, Format='(F0.2)'
  IF Keyword_Set(ps) THEN BEGIN
     cgPS_Close, /PNG
     WDelete, !D.Window
  ENDIF
You see the result of this code in the figure below.
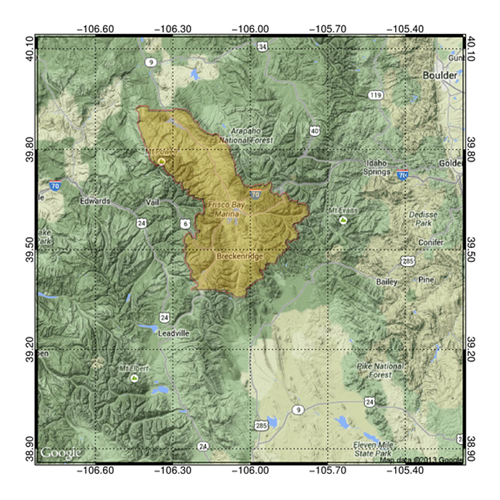 |
| The Summit County shape drawn as a transparent polygon on a Google map. |
You can find the code and data for this figure on the Coyote Gallery page.
![]()
Version of IDL used to prepare this article: IDL 8.2.3.
![]()
![]()


