
Meaning of the CHISQR Keyword


QUESTION: I am trying to understand the meaning of the CHISQR keyword in the IDL routines POLY_FIT, SVDFIT, and LINFIT. The definition of this keyword in the on-line documentation seems to be the same: Set this keyword to a named variable that will contain the value of the unreduced chi-square goodness-of-fit statistic. But, when I look at a simple example, shown below, I get different values for this keyword in the three routines. Am I doing something wrong?
   IDL> x = [1,2,3,4] & y = [1,2,3,4]
   IDL> r = Poly_Fit(x, y, 1, CHISQ=chisqr) & Print, chisqr
        1.14631e-30
   IDL> r = SvdFit(x, y, 2, CHISQ=chisqr) & Print, chisqr
        2.86139e-13
   IDL> r = LinFit(x, y, CHISQR=chrsqr) & Print, chisqr
        0.0000
![]()
ANSWER: The problem here is how you are selecting the data for your "simple" example. Normally, the chi square goodness of fit statistic calculates how closely a curve fitting function produces output that resembles the actual data. In this case, since your data describes a straight line, and since straight lines can be fit more or less exactly, there is no error to calculate. What you see here are floating point round-off errors that are all very, very close to 0, the expected chi square value. If you throw a bit of randomness into your example, the results will make more sense to you.
   IDL> x = [1,2,3,4] & y = [1,2,3,4] + Randomu(-3L, 4) * 0.5
   IDL> r = Poly_Fit(x, y, 1, CHISQ=chisqr) & Print, chisqr
        0.0360563
   IDL> r = SvdFit(x, y, 2, CHISQ=chisqr) & Print, chisqr
        0.0360563
   IDL> r = LinFit(x, y, CHISQR=chrsqr) & Print, chisqr
        0.0360563
The chi square statistic is used to assess the goodness of fit of curves to the data. It assumes the errors are independent of each other and normally distributed. Normally, one can think of the value as a number on a chi square distribution curve. To see if the number is "significant" or not, you look the chi square number up in a chi-squared distribution table, according to the number of degrees of freedom in your calculation.
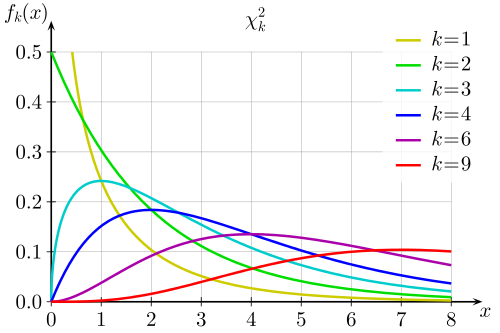 |
| Chi Square curves for various degrees of freedom. Table courtesy of Wikipedia |
In practice, the number represents the total error between the fit and the actual data values, squared.
   IDL> r = LinFit(x, y, YFit=yfit)
   IDL> Print, Total((y - yfit)^2)
        0.0360563
Note, too, that when you are computing fits like this it is always a good idea to do the calculations using double precision math. Simply set the Double keyword when you call these routines.
   IDL> r = LinFit(x, y, YFit=yfit, /Double)
   IDL> Print, Total((y - yfit)^2)
        0.036056320
![]()
Version of IDL used to prepare this article: IDL 8.2.
![]()
![]()


