
Legend Disappears on Log Plot
QUESTION: I am trying to put a legend on a log plot with the IDL 8.1 function graphics commands, but the legend never shows up, and I don't get an error. For example, this code produces a legend perfectly.
   p1 = Plot(Findgen(20)+1, Name='Line 1')
   p2 = Plot(Findgen(20)*2+1, Name='Line 2', LineStyle=2, /Overplot)
   leg = Legend(Position=[3,30], /Data)
You see the expected result in the figure below.
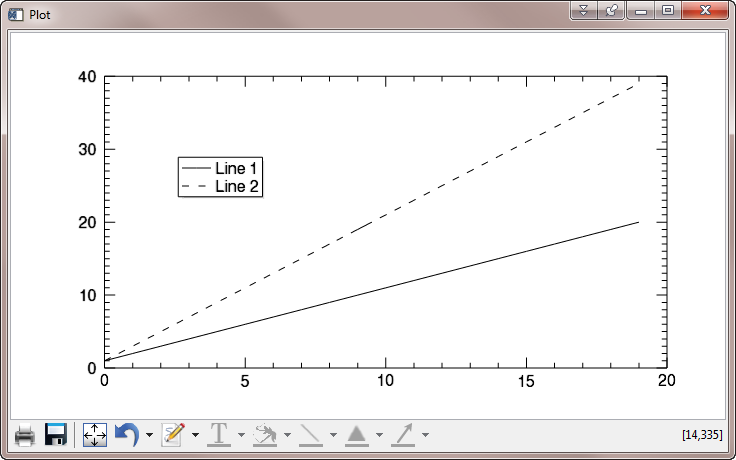 |
| The legend appears as expected in a linear plot. |
However, if I turn the Y axis into a log axis, I don't get any errors, but the legend just never shows up! What is going on here?
   p1 = Plot(Findgen(20)+1, Name='Line 1', /YLOG)
   p2 = Plot(Findgen(20)*2+1, Name='Line 2', LineStyle=2, /Overplot)
   leg = Legend(Position=[3,30], /Data)
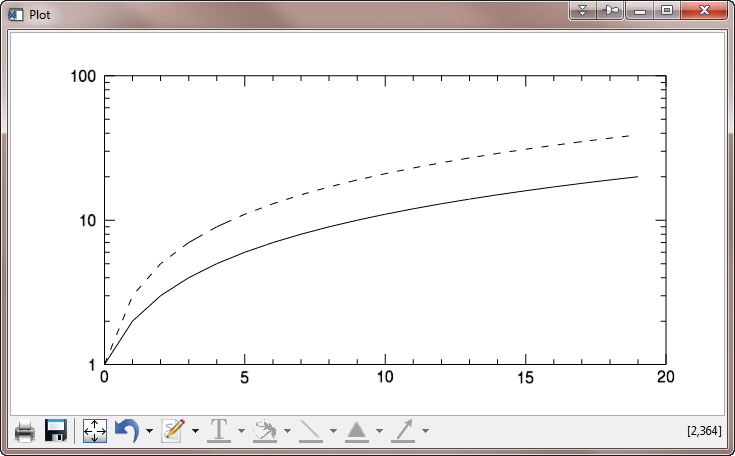 |
| The legend doesn't appear in a log plot. |
![]()
ANSWER: Yes, this missing legend problem is a known bug that is reported to have been fixed and will be released in IDL 8.2. I suspect (although I don't know for sure) that the same bug is responsible for the legend jumping around from place to place as you resize the window with the linear plot in it.
The bug causes the normalized coordinates of the legend in the window to be miscalculated. You can see this is so by printing the legend object after you create the log plot.
   IDL> Print, leg
        LEGEND <139965>
          COLOR                     = 0   0   0
          FONT_NAME                 = 'Helvetica'
          FONT_SIZE                 = 12.000000
          FONT_STYLE                = 0
          HIDE                      = 0
          HORIZONTAL_ALIGNMENT      = 0.00000000
          HORIZONTAL_SPACING        = 0.020000000
          LINESTYLE                 = 0
          NAME                      = 'Legend'
          ORIENTATION               = 0
          POSITION                  = 0.33197961       11.530000
          SAMPLE_WIDTH              = 0.15000000
          SHADOW                    = 1
          TEXT_COLOR                = 0   0   0
          THICK                     = 1.00000
          TRANSPARENCY              = 0
          VERTICAL_ALIGNMENT        = 1.0000000
          VERTICAL_SPACING          = 0.020000000
The position of the legend (POSITION) is listed in normalized coordinates (0 to 1 in the window). As you can see, the Y coordinate is completely off the window (and your display!!).
One possible work-around for this is to position the legend using normalized coordinates, like this.
   p1 = Plot(Findgen(20)+1, Name='Line 1', /YLOG)
   p2 = Plot(Findgen(20)*2+1, Name='Line 2', LineStyle=2, /Overplot)
   leg = Legend(Position=[0.25, 0.75], /Normal)
This doesn't keep the legend from jumping around (or even disappearing from the window!) as you resize the window, but it does work to put it in the correct location when the plot first appears.
 |
| Use normalized coordinates to position the legend on the display when using log axes. |
![]()
Version of IDL used to prepare this article: IDL 8.1.
![]()
![]()


