
Aligning Overlapping Histogram Plots


QUESTION: I am trying to overplot one histogram on top of another using the cgHistoplot program, but for some reason the plots don't seem to align with one another. The second plot is slightly offset from the other. You can see this is the figure below. Here is the code I am using. Is this a bug in the program?
   binsize = 0.5
   cgHistoplot, new, Binsize=binsize, /Fill, XRange=[-25, -4]
   cgHistoplot, old, Binsize=binsize, /OPlot, Color='navy'
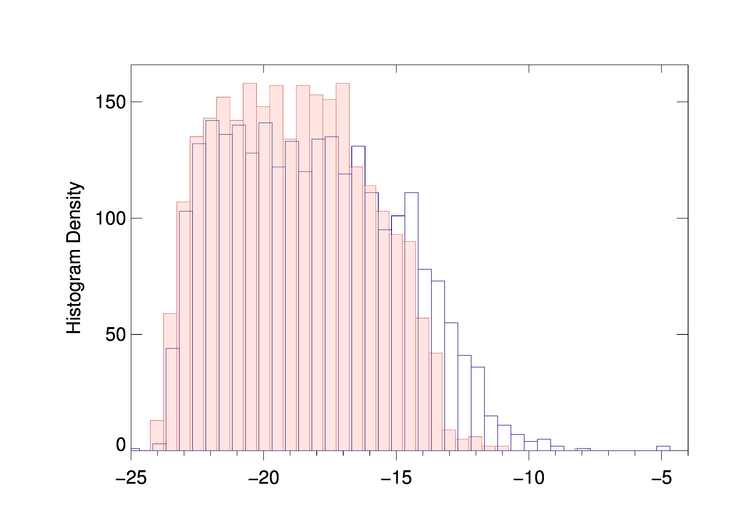 |
| The two histograms are slightly offset from one another. |
![]()
ANSWER: No this isn't a bug. But the two datasets you are using, new and old, have different data ranges.
   IDL> minmax, new
        MinMax:       -24.271000      -8.0480000
   IDL> minmax, old
        MinMax:       -31.680000      -4.7200000
As a result, their histograms are calculated in slightly different ways. In particular, they have different minimum values as input to the Histogram function in IDL. If you are going to compare two data sets like this, you have to make sure the histogram is computed in exactly the same way (and with the same bin size) for the two data sets. This is done by specifying the MinInput and MaxInput keywords, which set the Min and Max keywords of the IDL Histogram command, after doing some error checking to be sure their data type matches the bin size data type.
Here is the code that will produce the plot you want. You see the final result in the figure below.
   binsize = 0.5
   cgHistoplot, new, Binsize=binsize, /Fill, MinInput=-25, MaxInput=-4
   cgHistoplot, old, Binsize=binsize, /OPlot, Color='navy', MinInput=-25, MaxInput=-4
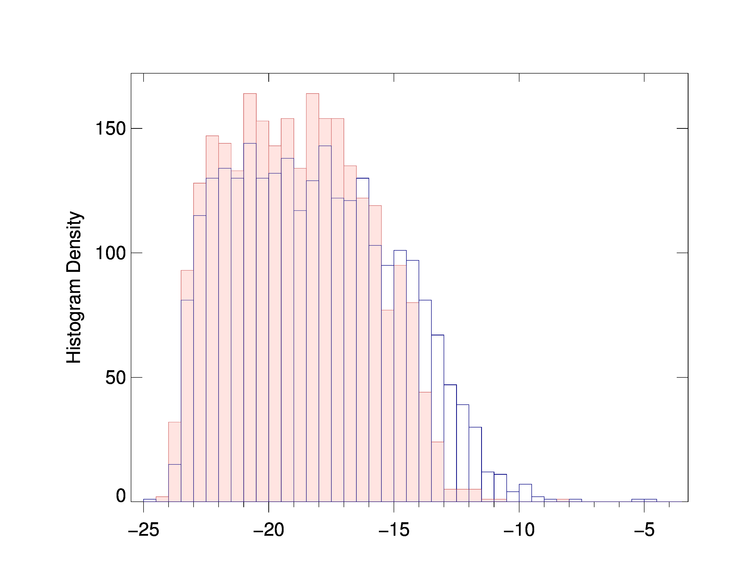 |
| The two histograms are aligned to one another. |
![]()
Version of IDL used to prepare this article: IDL 8.2.3.
![]()
![]()


