Graphics Display Programs
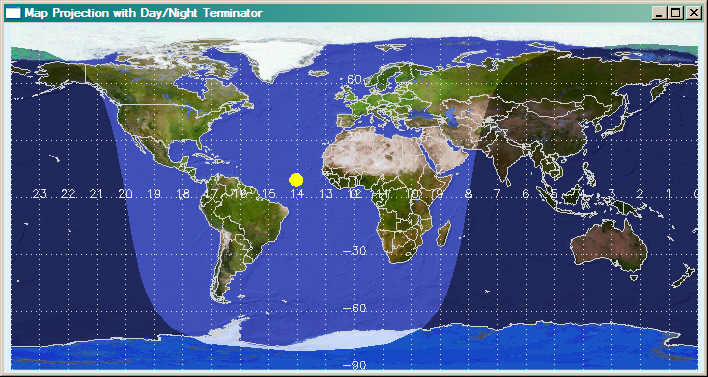
- cgTERMINATORMAP Draws map with day/night terminator displayed.
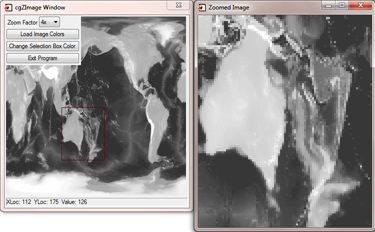
- cgZIMAGE Zooms into image with rubberband selection technique. (Uses direct graphics.)
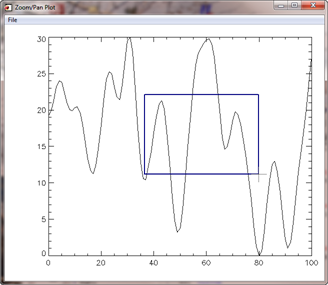
- cgZPLOT Zooms into line plot with rubberband selection technique.
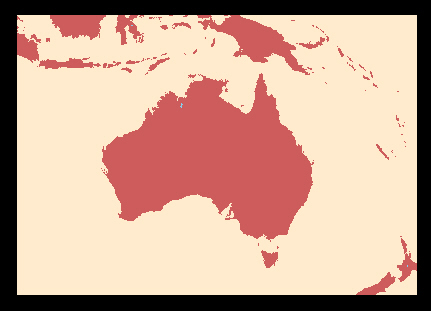
- MAP_GSHHS_SHORELINE Draws shorelines using the GSHHS data base in manner of MAP_CONTINENTS.
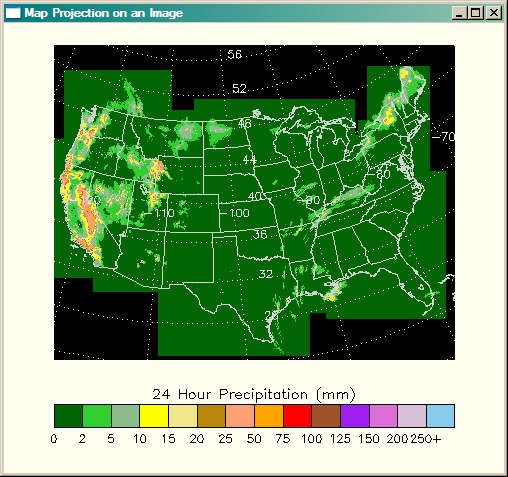
- PRECIPMAP Demonstrates how to fit a map coordinate system to a map-projected image.
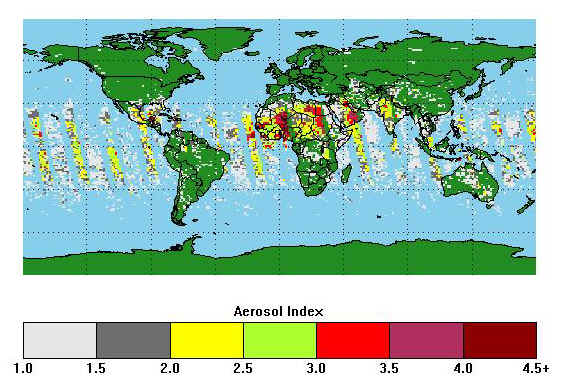
- READ_TOMS_AEROSOL Demonstrates how to overlay satellite imagery on a map projection.
- STATIONPLOT Plots meteorological "station" data. Used with WINDBARB
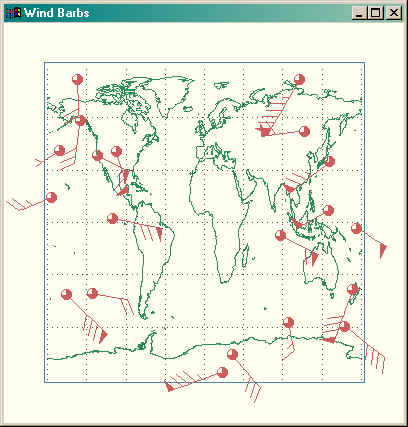
- WINDBARB Plots meteorological wind barbs.
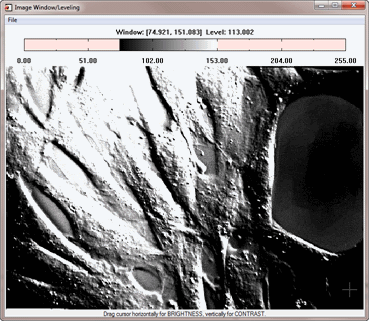
- WINDOWIMAGE Interactively change the contrast and brightness of an image using direct graphics.


|
|
|
This program allows you to "zoom" into a portion of an image.
It illustrates how to use pixmaps and the "device copy" technique to
create a rubberband box on top of an image. It also illustrates a
very powerful technique of having several event handlers for an
individual widget and switching between them. The image location
and the image value at that location is output in a status bar widget
in newer versions of this program. This makes your programs
more modular and easier to maintain. Right clicking in the image
window pulls up hidden zoom controls. (For the equivalent program written with object graphics,
see ZOOMBOX.)
|
|
|
|
This routine allows the user to interact with a line plot created with cgPlot.
Users can zoom and pan into the line plot display. There is a multiple undo and redo
capability, and users can "tweak" the zoom by clicking the LEFT mouse button outside
of the plot boundaries. Clicking inside the plot boundaries with the LEFT mouse button
will allow a rubberband-box zoom in both the X and Y directions. A button is available
that can "adjust" the Y range of the zoomed-in plot to completely show the values
indicated by the X range of the zoomed-in plot. Combined with Undo and Redo (all
implemented at key combination shortcuts), this allows the user to "pull-in and back-out"
of zoomed plots. The RIGHT mouse button allows fast panning of the plot in the display
window. The program is written as a stand-alone application, but it is also a
compound widget object, which means you can have a zoom/pan window in your own
IDL application.
|
|
|
|
Some people prefer the higher precision of the
Global Self-consistent, Hierarchical, High-resolution, Shoreline (GSHHS) database for drawing continental outlines and other shorelines to the built-in CIA
database that comes with IDL. This program works in way analogous to MAP_CONTINENTS, in that it allows
the user to draw shoreline boundaries into a map projection space set up with either MAP_SET or
MAP_PROJ_INIT. You see example output below from running the program with the highest resolution
GSHHS file. Detailed instructions for using this program are
described in an accompanying article.
|
|
|
|
This program is strictly a demonstration program to illustrate how to create a
map coordinate system on top of an image that is already gridded into a map projection.
It uses a precipitation image that is gridded into a polar stereographic map projection.
|
|
|
|
This program is strictly a demonstration program to illustrate how to overlay
satellite data onto an IDL map projection in a device-independent way. That is to say,
the output of the program should look identical (as much as is reasonably possible)
on the display and in PostScript output. The program is discussed in detail in
this tutorial article. Output
of the program looks similar to the image below.
|
|
|
|
This program allows you to plot meteorological "stations" on a map
project or other plot. See the WINDBARB program below
for a picture of what station plots look like. This was written primarily to
be used by the WINDBARB program.
|
|
|
|
This program allows you to plot meteorological wind barbs on a map or
other graphical display. Wind barbs show the direction and speed of the wind
at a particular location. The figure below shows wind barbs plotted along with
station plots on a map projection. To plot stations, you will require the
StationPlot program, too.
|
|
|
|
This program demonstrates how to write a program to interactively change the
contrast and brightness of an image. This is sometimes called the window level and window
width. This kind of interaction is often required when working with 16-bit medical images.
Details of the algorithm used in this program can be found in the article
Image Contrast and Brightness Adjustment.
|
Copyright ©
1996–2018 Fanning Software Consulting, Inc.
Last Updated: 21 March 2011