
Converting an IDL Program to Coyote Graphics


QUESTION: OK, ok. I just looked at a calendar and realize it's the 21st century. I learned to program in the 1970s, but maybe it's possible to teach an old dog new tricks. Do you have any tips for how I can convert these old, reliable IDL programs to use these Coyote Graphics routines? I really like how Coyote Graphics programs can be used to create fantastic high quality output and don't care about whether I am using indexed or decomposed color.
![]()
ANSWER: Yes, I have a number of tips for you. And I will probably add more as I think of them. Check back here frequently for updates.
Many people think that to do a conversion they are going to have to replace all their Plot commands with cgPlot, and so on, and so forth. It seems a daunting task for them, and they are reluctant to get started. But, while there are excellent reasons for switching to Coyote Graphics routines for programs you plan to write in the future, the good news is, you don't have to do much to turn your current IDL programs into device independent programs that can produce high-quality output.
There are really just three important things you have to do, and you can learn to do them in about five minutes.
- Create a Color Model Independent Program
- Create a Device Independent Program
- Display Your Program in a Resizeable Graphics Window
If you find you want or need more details then I can explain in this article, then you can always find the answer to any Coyote Graphics question in the book, Traditional IDL Graphics, whose cover you see just to your right. Click on that to learn more!
![]()
Create a Color Independent Program
Alright, I don't want to say this too loudly, but virtually the entire secret to the power of Coyote Graphics routines is contained in a single program, cgColor. If you can get the color you want without caring whether you are using the indexed color model or the decomposed color model, then you are nearly home free when it comes to writing IDL programs that work everywhere, all the time.
The cgColor program is embedded in every Coyote Graphics routine, and is what makes it possible to specify a color by name and be certain that is the color you are going to get in your output.
cgPlot, cgDemoData(1), Color='red'
It is well known that cgColor can turn a color name into an approprate color value. But, please note that when using indexed color, cgColor must load the color somewhere in the hardware color table so it can be used by your program. This is one of the obvious downsides of using indexed color: it is easy to contaminate the one and only hardware color table with drawing colors. This is why Coyote Graphics routines always use, if it is possible to do so, decomposed color when drawing graphics. If you want to make the switch to 21st century graphics, give up the notion that you have to work in indexed color mode and take that "device, decomposed=0" command out of your IDL start-up file. It may take you a week or so to get the hang of things, but once you do, there will be no turning back. Everything you do will become so much easier.
  IDL> SetDecomposedState, 0 ; Indexed Color
  IDL> Print, cgColor('yellow')
       115
  IDL> SetDecomposedState, 1 ; Decomposed Color
  IDL> Print, cgColor('yellow')
       65535
What is less well known is that it can do the same thing with numerical values. For example, cgColor can also convert a color index number of the current color table into an appropriate value if the index number is represented as a byte, a short integer, or a string. Here we load the color yellow at location 200 in the color table and access it in three different ways.
   IDL> TVLCT, cgColor('yellow', /Triple), 200
   IDL> Print, cgColor(200B)
        65535
   IDL> Print, cgColor(200S)
        65535
   IDL> Print, cgColor('200')
        65535
Unfortunately, you can't, however, use a long integer, since long integers are how cgColor actually specifies colors most of the time.
   IDL> Print, cgColor(200L)
        200
Long integers are simply passed through cgColor, as are byte, short integer, and string values, if you are using indexed color.
   IDL> SetDecomposedState, 0 ; Indexed Color.
   IDL> Print, cgColor(200B)
        200
   IDL> Print, cgColor(200S)
        200
   IDL> Print, cgColor('200')
        200
   IDL> SetDecomposedState, 1 ; Decomposed Color.
HINT: If, for some reason, colors don't seem to be working in Coyote Graphics routines, check to be sure you are not passing long integers when you mean to be passing byte or short integer values. This is a common mistake if you using the compiler option DEFINT32 to make sure integers are created as long integers by default.
So, the first step to make your programs color independent is to turn color decomposition on in your program, and use cgColor to obtain the proper color values. Consider this simple direct graphics program. (This program is too simple to be one of your programs. There is no error handling or parameter checking, whatsoever. Well, on second thought, maybe it does resemble one of your programs! But, we will leave that stuff for another time.)
   PRO PlotCurves, curve_1, curve_2
      Window, XSize=600, YSize=400, /Free
      LoadCT, 39
      Plot, curve_1, /NoData, XTitle='Time', YTitle='Signal'
      OPlot, curve_1, Color=120
      Oplot, curve_2, Color=200
   END
We will call the program like this, using cgDemoData to create two random data vectors. Note that we have to be sure we run this program using indexed color, or both curves on the plot will show up in shades of red! (Try it and see. Can you explain why this occurs? If not, maybe you want to read the Working with Color chapter of my current book.)
   data_1 = cgDemoData(17)
   data_2 = cgDemoData(17)
   SetDecomposedState, 0 ; Indexed color.
   PlotCurves, data_1, data_2
You see the result in the figure below.
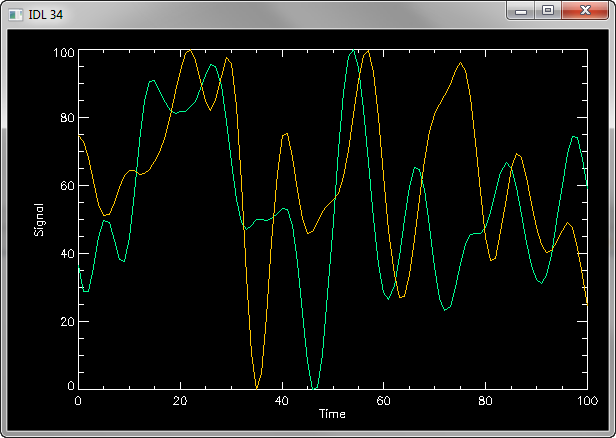 |
| A normal direct graphics program in IDL. |
The first thing to do, then, is to change the program as shown below. Notice we are also changing the background color of the plot from black to white. This is not a strict requirement, except that we want to write programs that work the same on the display and in the PostScript device, which always uses a white background. It is much easier to select drawing colors, if the display version of the program and the PostScript version use the same color background. Note how the color state is returned to the input color state at the end of the program.
   PRO PlotCurves, curve_1, curve_2
      Window, XSize=600, YSize=400, /Free
      LoadCT, 39
      SetDecomposedState, 1, Current=currentState
      Plot, curve_1, /NoData, XTitle='Time', YTitle='Signal', $
         Background=cgColor('white'), Color=cgColor('black')
      OPlot, curve_1, Color=cgColor('120')
      Oplot, curve_2, Color=cgColor('200')
      SetDecomposedState, currentState
   END
Calling this program the same way, you see the result below. Notice that the line colors, while the same in both programs, look different in each. This is because of the different background colors.
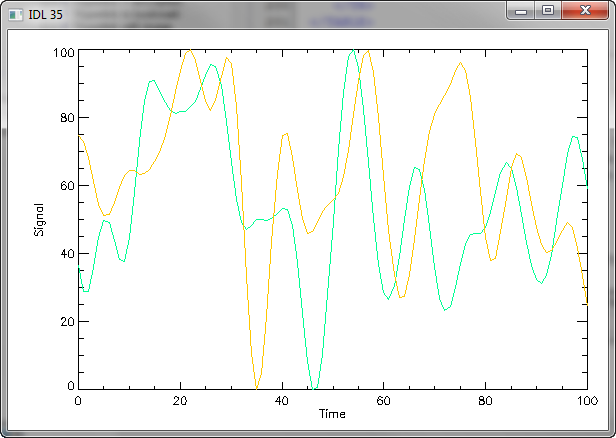 |
| The same program, but run with decomposed color and using cgColor to obtain the color values. |
You might want to choose better colors now that you are using a white background. If so, you can choose whatever color you like, since we are no longer restrained by the color table. In fact, since we are using decomposed color, we now have 16.7 million colors to choose from, instead of the original 256. Let's choose something boring, just for the fun of it. How about red and blue. If you don't know the names of colors to choose, you can use the cgPickColorName function to find one. Over 200 color names are available. While we are at it, let's remove the LoadCT command, since we are no longer using the color table. Here is the new code.
   PRO PlotCurves, curve_1, curve_2
      Window, XSize=600, YSize=400, /Free
      SetDecomposedState, 1, Current=currentState
      Plot, curve_1, /NoData, XTitle='Time', YTitle='Signal', $
         Background=cgColor('white'), Color=cgColor('black')
      OPlot, curve_1, Color=cgColor('red')
      Oplot, curve_2, Color=cgColor('blue')
      SetDecomposedState, currentState
   END
You see the result in the figure below.
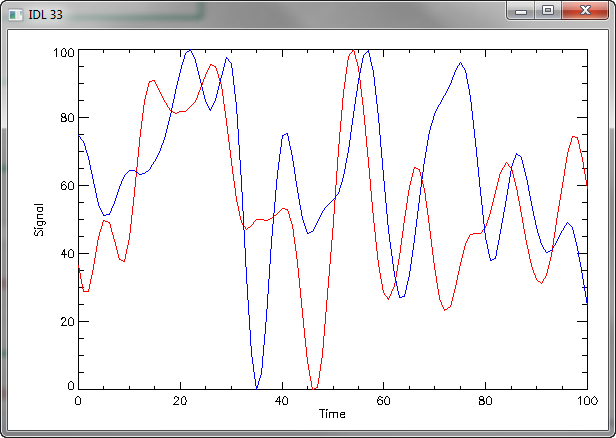 |
| The colors in this program are no longer tied to a color table. |
Check the program to be sure it works the same in both an indexed and decomposed color environment.
NOTE: Just a short note about what to do with any TV or TVSCL commands you might have in your program. Get rid of them. Get rid of all of them! The TV command is what is trapping you in the last century. I am going to suggest you use cgImage from the Coyote Library instead, but you can find other alternatives on the Internet (ImgDisp by Liam Gumley is a popular choice.) But, use a routine that is color model independent or you will never move forward with your IDL programming skills. The cgImage program has too many advantages to list them all here, but aside from cgColor, this program is the most important program in the Coyote Library. If you just want to do nothing more than use the color independence of the program, then you can replace all your TV commands with cgImage, with its TV keyword set, like this:
    TV, image, ....
    cgImage, /TV, image, ...
To replace TVSCL commands, use cgImage with the SCALE keyword set.
   TVSCL, image, ...
   cgImage, /TV, /SCALE, image, ...
You will quickly discover many reasons to remove that TV keyword from the cgImage command!
![]()
Create a Device Independent Program
The next step is to make your program device independent. In Coyote Graphics terms, this means make sure it works the same in a PostScript file as it does on the display.
Let's see what happens if we try to create a PostScript file with our program. Here is the code we use.
   cgPS_Open, 'plotcurves.ps'
   PlotCurves, data_1, data_2
   cgPS_Close
When we run this code, here is the error we get.
   PostScript output will be created here: C:\IDL\plotcurves.ps
   % WINDOW: Routine is not defined for current graphics device.
   % Execution halted at: PLOTCURVES          2 C:\IDL\default\plotcurves.pro
   %                      $MAIN$              1 C:\IDL\default\plotcurves.pro
   Encountered problem fixing landscape PostScript file. Proceeding...
What happened?
In this case, we have a Window command in our program. This is not an allowed command in the PostScript device. There are other such commands, as well, usually having to do with graphics windows, which obviously don't exist in a PostScript file. Another such command is the WSet command. Also, you don't want to specify the locations of things in your graphics window with DEVICE coordinates, since these are very different on your display and in a PostScript file. Use NORMAL or DATA coordinates instead.
If you do have "illegal" commands in your program, you have to "protect" them so they don't get executed in the PostScript device. Normally, window commands are only issued if the device supports windows. (The PostScript device does not.) You can tell if the device supports windows by examining the !D.Flag system variable. Here is the way we might protect this Window command in our program.
IF (!D.Flags AND 256) NE 0 THEN Window, XSize=600, YSize=400, /Free
This is a general method that always works for protecting commands in a PostScript file. But, Coyote Graphics routines use a different method for Window commands. In fact, Coyote Graphics routines don't use the Window command at all. Instead they use a cgDisplay command. The cgDisplay command is almost identical to a Window command, in that it creates a graphics window on the display, although it erases the window with a white color. But, in a PostScript file, the command produces a PostScript "window" or drawing area that has the requested aspect ratio. This makes it much easier to write programs that look the same on the display and in the PostScript or raster file output.
So, in this step, we simply replace any Window command with the cgDisplay command and protect any other window command we might have in the program. Here is the code now.
   PRO PlotCurves, curve_1, curve_2
      cgDisplay, 600, 400, /Free
      SetDecomposedState, 1, Current=currentState
      Plot, curve_1, /NoData, XTitle='Time', YTitle='Signal', $
         Background=cgColor('white'), Color=cgColor('black')
      OPlot, curve_1, Color=cgColor('red')
      Oplot, curve_2, Color=cgColor('blue')
      SetDecomposedState, currentState
   END
You can confirm that the program works the same on your display. But, now, it also works in the PostScript device, so we make a PostScript file like this.
   IDL> cgPS_Open, 'plotcurves.ps'
   IDL> PlotCurves, data_1, data_2
   IDL> cgPS_Close
You see the result below. Since I can't directly display a PostScript file on a web page, I have converted the resulting PostScript file to a PNG file by simply modifying the cgPS_Closecommand with additional keywords that create PNG or other raster file output directly from PostScript intermediate files, using ImageMagick. The cgPS_Closecommand I acutally used to create the figure below is this. Note that the output has the same aspect ratio as the previous figures.
IDL> cgPS_Close, /PNG, Width=600
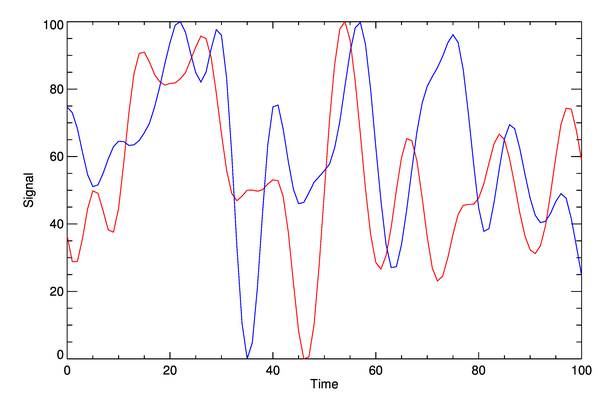 |
| PostScript output converted to a PNG file with ImageMagick. |
![]()
Display the Program in a Resizeable Graphics Window
This program is ready to be displayed in the Coyote Graphics resizeable graphics window, cgWindow. The requirements to do so is that your program be written with no more than three positional parameters, which yours is. You may add an unlimited number of keywords. If the program you want to convert has more positional parameters than this, you may have to convert some of those parameters to keywords if you want to display the program in a resizeable graphics window. (You certainly don't have to.)
Here is the way you would do it. Simply pass the name of your program to cgWindow as a string and include all the necessary positional and keyword parameters.
cgWindow, 'plotcurves', data_1, data_2
You see the result in the figure below. Additional Coyote Graphics functionality is available via pull-down menu selections.
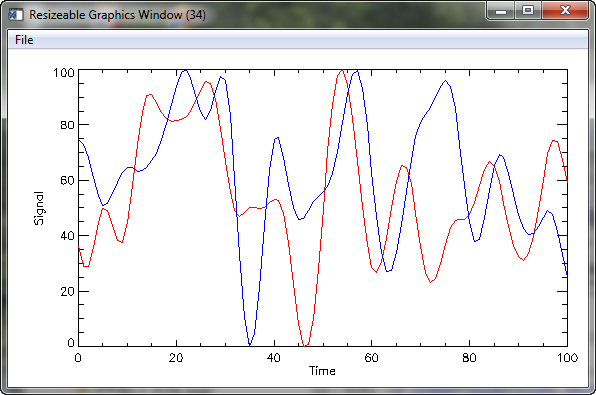 |
| The PlotCurves program displayed in
a resizeable graphics window, with options for creating PostScript and raster file output. |
If you want to write this program so that it can display itself in a resizeable window automatically if the Window keyword is set, as all Coyote Graphics commands do, then all you have to do is define a Window keyword and call the command above if the keyword is set. Here is the code.
   PRO PlotCurves, curve_1, curve_2, Window=window

      IF Keyword_Set(window) THEN BEGIN
        ; Open a new window or replace the current commands, as required.
        currentWindow = cgQuery(/CURRENT, COUNT=wincnt)
        IF wincnt EQ 0 THEN replaceCmd = 0 ELSE replaceCmd=1
         cgWindow, 'PlotCurves', curve_1, curve_2, ReplaceCmd=replaceCmd, $
             WXSize=600, WYSize=400
         RETURN
      ENDIF ELSE BEGIN
         ; Create a normal graphics window.
         cgDisplay, 600, 400, /Free
      ENDELSE

      SetDecomposedState, 1, Current=currentState
      Plot, curve_1, /NoData, XTitle='Time', YTitle='Signal', $
         Background=cgColor('white'), Color=cgColor('black')
      OPlot, curve_1, Color=cgColor('red')
      Oplot, curve_2, Color=cgColor('blue')
      SetDecomposedState, currentState
   END
If you wanted to take this even farther, and replace the Plot and OPlot commands with Coyote Graphics commands, you could. Simply remove all the calls to cgColor, since cgColor is embedded in all Coyote Graphics commands. Note that we can remove the colors entirely from the cgPlot command, because this program will always create a white background with black foreground when it draws the plot. (At least it will if you have the lastest Coyote Library installed.) The complete converted program will look like this.
   PRO PlotCurves, curve_1, curve_2, Window=window

      IF Keyword_Set(window) THEN BEGIN
        ; Open a new window or replace the current commands, as required.
        currentWindow = cgQuery(/CURRENT, COUNT=wincnt)
        IF wincnt EQ 0 THEN replaceCmd = 0 ELSE replaceCmd=1
         cgWindow, 'PlotCurves', curve_1, curve_2, ReplaceCmd=replaceCmd, $
             WXSize=600, WYSize=400
         RETURN
      ENDIF ELSE BEGIN
         ; Create a normal graphics window.
         cgDisplay, 600, 400, /Free
      ENDELSE

      SetDecomposedState, 1, Current=currentState
      cgPlot, curve_1, /NoData, XTitle='Time', YTitle='Signal', $
         Background='white', Color='black'
      cgOPlot, curve_1, Color='red'
      cgOplot, curve_2, Color='blue'
      SetDecomposedState, currentState
   END
![]()
Version of IDL used to prepare this article: IDL 8.2.1.
![]()
![]()


